
Sleep
The Southwest Journal of Pulmonary and Critical Care and Sleep publishes articles related to those who treat sleep disorders in sleep medicine from a variety of primary backgrounds, including pulmonology, neurology, psychiatry, psychology, otolaryngology, and dentistry. Manuscripts may be either basic or clinical original investigations or review articles. Potential authors of review articles are encouraged to contact the editors before submission, however, unsolicited review articles will be considered.
Associations Between Insomnia and Obstructive Sleep Apnea with Nutritional Intake After Involuntary Job Loss
Salma Batool-Anwar, MD, MPH1
Patricia L. Haynes, MPH2
Aria Panchal3
Stuart F. Quan, MD1,2
1Division of Sleep and Circadian Disorders, Brigham and Women’s Hospital, Harvard Medical School, Boston, MA; 2Mel and Enid Zuckerman College of Public Health, University of Arizona, Tucson, AZ, 3University of Toronto, Canada
Abstract
Objectives: Involuntary job loss is a stressful life event that can result in changes in nutritional intake. Both insomnia and obstructive sleep apnea (OSA) also are associated with alterations in dietary intake, but the extent to which this occurs in those who have experienced involuntary job loss is unclear. This study assessed nutritional intake in recently unemployed persons with insomnia and obstructive sleep apnea in comparison to those without a sleep disorder.
Methods: Participants from the Assessing Daily Activity Patterns through Occupational Transitions (ADAPT) study were screened for sleep disorders using the Duke Structured Interview for Sleep Disorders. They were classified as having OSA, acute or chronic insomnia or no sleep disorder. Dietary data was collected using United States Department of Agriculture Multipass Dietary recall methodology.
Results: A total of 113 participants had evaluable data and were included in this study. The cohort was comprised mainly of women (62%) and 24% were non-Hispanic white. Participants with OSA had a higher BMI compared with no sleep disorder (30.6 ± 9.1 vs 27.4 ± 7.1 kg/m2, p≤0.001). Those with acute insomnia had significantly decreased consumption of total protein (61.5 ± 4.7 vs. 77.9 ± 4.9 g, p≤0.05) and total fat (60.0 ± 4.4 vs. 80.5 ± 4.6 g, p≤0.05). Among the participants with chronic insomnia, there was little overall difference in nutrient consumption compared to the no sleep disorder group although there were several gender specific differences. There were no overall differences between participants with OSA in comparison to no sleep disorder, but women consumed less total fat (89.0 ± 6.7 vs. 57.5 ± 8.0 g, p≤0.01). The Healthy Eating Index of all groups was below the average value of Americans.
Conclusion: Unemployed persons compared to those with sleep disorders differ in their consumption of major nutrients; the dietary composition of those with acute insomnia exhibited the greatest divergence. Additionally, the overall nutritional intake of recently unemployed persons is poor.
Key Words: unemployment, insomnia, obstructive sleep apnea, nutrition, diet
Introduction
Sleep is a vital component of healthy living. According to the National Sleep Foundation and the American Academy of Sleep Medicine, 7-8 hours of regular sleep is essential for maintenance and restoration of metabolic homeostasis and to promote optimal health. Unfortunately increasing numbers of people across the globe suffer from sleep deprivation or sleep disorders (1).
Insomnia and obstructive sleep apnea (OSA) are considered health risks and have been linked with cardiovascular diseases (2), increased risk of accidents (3), loss of productivity, worsening metabolic profiles (4), and even premature mortality (5,6). Certain population subgroups comprising of night shift workers, minorities (racial/ethnic), those with fewer years of education or those belonging to lower socioeconomic class (SES) have been shown to be particularly susceptible to several of these adverse consequences.
A major determinant of SES is employment status. Unemployment can result from involuntary job loss, a stressful and disruptive life event. Moreover, joblessness is associated with insomnia symptoms (7), and we have demonstrated an association between recent job loss and OSA (8).
Both insomnia and OSA are associated with differences in nutritional intake in comparison to non-affected persons. Furthermore, we have demonstrated that the quality of nutritional intake is worse in recently unemployed persons (9). However, the impact of insomnia disorder or OSA on nutritional intake has not been evaluated in this population. The Assessing Daily Activity Patterns through Occupational Transitions (ADAPT) Study (10) is an ongoing longitudinal cohort study of individuals who have suffered involuntary job loss in the last 90 days with data collected on the effects of sleep and sleep disorders on nutritional intake and metabolic outcomes. To better understand the immediate health aftermath of job loss, we analyzed cross sectional data from the baseline assessment of the ADAPT study to assess the associations between two sleep disorders, insomnia disorder and OSA, and nutritional intake.
Methods
Participants
Study participants were part of the ADAPT Study, an 18-month longitudinal study that examined changes in sleep, social rhythms, and obesity following an involuntary job loss (10). The study protocol and recruitment strategy have been described in detail previously. Briefly, all individuals who applied for unemployment insurance (UI) in the greater Tucson, Arizona and surrounding areas between October 2015 and December 2018 received study recruitment flyers within their UI intake packets. Interested individuals contacted study staff and completed phone screens assessing exclusion criteria; potentially eligible individuals were then scheduled for in-person screening visits. Individuals were eligible if they had experienced an involuntary job loss within 90 days of study enrollment, had been with their employer for at least six months, were currently employed less than 5 hours per week and did not complete any night shift work within the last 30 days. During the in-person screening, participants provided written informed consent, as well as information about their demographics, employment and medical history. They also were screened for homelessness, existing physiological and mental health conditions, substance abuse, and major sleep diagnoses which could interfere with social rhythms and sleep patterns. Those who passed screening completed validated mental health and sleep diagnostic interviews.
Data used in this analysis originated from the study’s baseline visit. Of the 446 adults who provided written consent, 191 participants met eligibility criteria and completed a baseline assessment visit, including an at-home data collection period lasting two weeks. Participants were considered for the current analysis if there was an acceptable assessment of sleep and diet on their sleep diaries and dietary recalls respectively for analysis. However, 8 participants were excluded as outliers because their mean energy consumption (MEC) was significantly less than commonly reported norms (11, 12). In addition, data for all variables used in analyses were available for only 113 participants. Descriptive statistics for these participants who constitute the study sample are reported in Table 1.
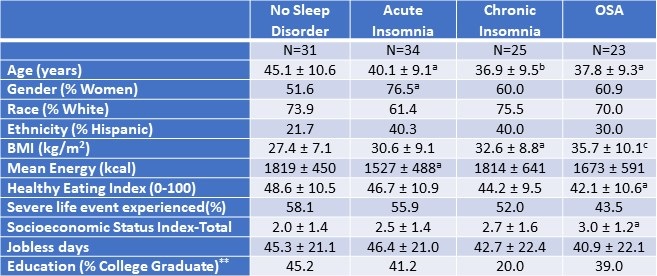
Table 1. Demographic and Anthropometric Characteristics of the Study Population.*
 *Data presented as mean ± SD or percentages as appropriate; ap<0.05; bp<0.01; cp<0.001 vs. No Sleep Disorder; **SES assessed as the sum of 4 component scores; education, Income, Employment, and Housing. Click here to open Table 1 in a separate, enlarged window.
Measures
Demographic and Anthropometric
Age, ethnicity and biological sex were collected during the initial interview. Height and weight were measured using a stadiometer and bioelectrical impedance analyzer via standardized protocols to calculate the body mass index (kg/m2, BMI). Stressful life events were measured using the Life Events and Difficulties Schedule (LEDS -2) (13), a semi-structured interview and consensus panel rating system in which at least three raters provided contextual assessment of threat associated with different life events over the last three months. All raters were trained and required to achieve a kappa of 0.75 with a trained and reliable rater prior to participation in the rating meeting. Life events were considered severe if they conferred a high degree of threat or unpleasantness during both the immediate aftermath of an event and over the next 10 to 14 days. As in our previous (0=less than high school, 1=high school/some college, 2=bachelor’s degree, 4=postgraduate degree), Income (0=less than or equal to 100% of U.S. poverty line, 1=101-200% of poverty line, 2=201-400% of poverty line, 3=greater than 400% of poverty line), Employment (0=unemployed in last 6 months, 1=employed during last 6 months), and Housing (0=not a homeowner, 1=homeowner).
Diet Assessment
During the two-week, at-home baseline data collection period, participants completed up to three 24-hour dietary recalls administered by trained diet assessors at the Behavioral Measurements and Interventions Shared Resource of the University of Arizona Cancer Center utilizing the gold-standard United States Department of Agriculture Multi-pass Dietary recall (15) and the Nutrient Database System of the University of Minnesota for nutrient analysis (16). These interviews were supported by the Remote Food Photography Method (17), in which participants took pictures of all food and beverages prior to consumption, as well as after they had finished eating and drinking. Photos were used to review recall as a final verification of the multi-pass data. The diet recalls provided information on the types and quantity of food, including energy and nutrient values. At least 3 dietary recalls were completed by 172 participants (95.6% of the entire ADAPT cohort).
Sleep Phenotypes
The Duke Structured Interview for Sleep Disorders (DSISD) (18) was used to classify participants into 4 phenotypes: no sleep disorder (Control), obstructive sleep apnea (OSA), acute insomnia disorder and chronic insomnia disorder. The DSISD is a clinical semi-structured interview developed to assess sleep disorder symptoms and was updated to reflect international classification of sleep disorders (ICSD-3) criteria (19). It is divided into 4 modules respectively focused on insomnia disorders, excessive sleepiness conditions, circadian rhythm disorders and parasomnias. During the interview, participants are asked a series of questions related to possible sleep disturbances. Sections of the questionnaire are skipped if the participant endorses negative answers to screening questions. The DSISD has been validated for classifying persons for OSA (20) and insomnia (18). The DSISD was administered by research staff trained in sleep disorder diagnosis, who met reliability levels of 75% with a licensed clinician (PH).
Statistical Analysis
For baseline characteristics, mean (SD) for continuous variables and percentages for categorical variables were calculated. For multivariate models, estimated marginal means are displayed as mean (SD). The participants without any sleep diagnosis were classified as “No Sleep Disorder”. After classifying participants into sleep phenotypes, comparisons of dietary constituents between No Sleep Disorder and OSA, No Sleep Disorder and acute insomnia and No Sleep Disorder and chronic insomnia groups were performed using analysis of covariance. Models were constructed initially without and subsequently with gender stratification. Included covariates were age, BMI, socioeconomic index, presence of a severe life event as measured by the Life Events and Difficulties schedule. The more liberal rating of severity, short term threat vs long term threat, was used for the purpose of this analysis (long term threat rating of at least 2b). The current variable for severe life events was dichotomized (1 = at least one severe event in the last 3 months; 0 = no severe events in the last 3 months). The level of statistical significance for both models was set at 0.05, but comparisons between 0.05 and 0.10 are provided to illustrate a trend. All statistical analyses were done using STATA version 11 (StataCorp, LLC, College Station, TX, USA) or IBM SPSS version 28 (Armonk, NY).
Results
Table 1 demonstrates the demographic and anthropometric characteristics of the study cohort. Both insomnia groups and the OSA group were younger than controls without a sleep disorder. There was a higher proportion of women in all groups (51.6%, 76.5%, 60%, and 60.9% among participants without any sleep disorder, with acute insomnia, with chronic insomnia, and with OSA respectively). Participants with OSA had a higher BMI compared with no sleep disorder (30.6 ± 9.1 vs 27.4 ± 7.1 kg/m2, p ≤ 0.001). Among the No Sleep Disorder group, 45.2% had college education compared with 20.0% among chronic insomnia, 41.2% in acute insomnia, and 39% among participants with OSA. The participants with acute insomnia had significantly less mean energy consumption in comparison to the control group without a sleep disorder (p<0.05). The proportion of participants who had experienced at least one severe life event was not significantly different amongst the groups.
Table 2 displays mean nutritional intakes for acute insomnia in comparison to controls without a sleep diagnosis stratified by gender.
Table 2. Mean Nutritional Intake--Acute Insomnia Compared to No Sleep Disorder Stratified by Gender.
 Data are shown as mean ± standard deviation. Non gender and gender stratified models are adjusted for BMI, severity of stress, socioeconomic status, and age. Mean estimates are evaluated at the following values: BMI = 29.3, severity of stress = .58, socioeconomic status total = 2.25, Age = 42.6 years. Click here to view Table 2 in an enlarged, separate window.
Acute insomnia was characterized by consumption of lower amounts of total protein (61.5 ± 4.7 vs. 77.9 ± 4.9 g, p≤0.05) and total fat (60.0 ± 4.4 vs. 80.5 ± 4.6, p≤0.05). Reductions in total protein were primarily a result of decreased amounts of animal protein. Decreased total fat was accompanied by lower amounts of trans fatty acids and saturated fatty acids. However, these latter results were driven primarily by lower amounts among women (trans fatty acids: 1.3 ± 0.2 vs 2.5 ± 0.3 g, p≤0.05 among women in comparison to 1.9 ± 0.4 vs 1.6 ± 0.3 g, p=NS among men; saturated fatty acids: 19.4 ± 2.3 vs 32.5 ± 2.8 g, p < 0.01 among women in comparison to 25.5 ± 4.2 vs 22.7 ± 2.8 g, p=NS among men). Similarly, those with acute insomnia consumed less cholesterol compared to those without any sleep disorder (357.2 ± 34.6 vs. 241.6 ± 33.4 mg, p≤0.05). In contrast these results were significant only among men (242.5 ± 71.4 mg vs 417 ± 48.2 g, p<0.05 compared to 242.2 ± 38.9 mg vs 299.7 mg ± 47.4, p= NS among women.
Mean nutritional intakes for chronic insomnia are shown in Table 3.
Table 3: Mean Nutritional Intake--Chronic Insomnia Compared to No Sleep Disorder Stratified by Gender.
 Data are shown as mean ± standard deviation. Non gender and gender stratified models are adjusted for BMI, severity of stress, socioeconomic status, and age. Mean estimates are evaluated at the following values: BMI = 29.7, severity of stress = .55, socioeconomic status = 2.29, Age = 41.4 years. Click here to view Table 3 in an enlarged, separate window.
There were no overall differences between chronic insomnia and no sleep disorder with the exception of cholesterol which was lower in chronic insomnia (348.7 ± 32.1 vs. 233.8 ± 36.3 mg, p≤0.05). However, after stratification by gender, men consumed more protein and cholesterol irrespective of sleep phenotype. In addition, there were several interactions; men with chronic insomnia consumed more fatty nutrients and women consumed less. Men with chronic insomnia also had greater intake of vegetable protein. (see Table 3 for numeric detail).
Table 4 provides the mean nutritional intake for participants with OSA in comparison to those with no sleep disorder.
Table 4. Mean Nutritional Intake—Obstructive Sleep Apnea (OSA) Compared to No Sleep Disorder Stratified by Gender.
 Data are shown as mean ± standard deviation. Gender and Non gender stratified models are adjusted for BMI, severity of stress, socioeconomic status, and age. Mean estimates are evaluated at the following values: BMI = 30.96, severity of stress = .52, socioeconomic status total = 2.39, Age = 41.96 years. Click here to view Table 4 in an enlarged, separate window.
Overall, there were few differences between those with OSA and no sleep disorder. However, less cholesterol was consumed by OSA participants than no sleep disorder (351.7 ± 34.9 vs. 222.0 ± 41.0 mg, p≤0.05). Irrespective of sleep phenotype, women consumed less total protein and animal protein in comparison to men. In addition, women with OSA consumed less fatty nutrients (See Table 4 for numeric detail).
Tables 2, 3, and 4 also show the mean energy intake and Healthy Eating Index for no sleep disorder, acute and chronic insomnia and OSA participants. Participants with acute insomnia consumed fewer calories than controls (1508 ± 88 vs. 1836 ± 90, p≤0.05); this finding was principally observed in women. For chronic insomnia and OSA, there were no overall differences in comparison to controls. However, there was an interaction between phenotype and gender such that women with chronic insomnia had the lowest energy intake. In contrast to an ideal Healthy Eating Index of 100 and the value for the average American diet of 58, no sleep disorder and all three sleep phenotypes had lower values.
Discussion
In this paper, we determined the associations among nutrient intake, acute and chronic insomnia and OSA. We found that participants with acute insomnia had decreased intake of proteins and fats. Among participants with chronic insomnia and OSA, there were few overall differences in dietary intake compared with persons with no sleep disorder. However, for both chronic insomnia and OSA, intake of some nutrients was different from no sleep disorder after gender stratification and also between men and women.
There has been increased interest in diet and sleep quality in recent years; previous epidemiologic studies have demonstrated bidirectional associations between diet quality and sleep (21) (22) (23). The results of our study are consistent with the prior research demonstrating an association between dietary content with sleep quality. Increased sleep efficiency in the elderly has been linked with increased intake of tryptophan (24) which is thought to convert to serotonin, a precursor to melatonin, after crossing the blood brain barrier (25). Katagiri et al (22) demonstrated improved sleep quality as measured by Pittsburgh Sleep Quality Index among participants with high intake of fish and vegetables, whereas poor sleep quality was seen in relation to high consumption of confectionary and noodles.
We observed reductions in protein intake among those with acute insomnia. Previous research has suggested an association between sleep and protein intake. A number of neurotransmitters are known to affect sleep-wake cycle namely 5-HT, gamma aminobutyric acid (GABA), orexin, melanin-concentrating hormone, and histamine(26); dietary precursors can influence the synthesis and function of some of these neurotransmitters. Synthesis of 5-HT is dependent on its precursor availability, the amino acid L tryptophan (Trp)(27). Similar to our results, in a cross-sectional study of non-shift workers, researchers demonstrated an association between low protein intake and poor sleep quality particularly with sleep initiation problems. In contradistinction, in another study of middle-aged Japanese, high protein intake was associated with difficulty maintaining sleep (28). Gao et al also confirmed the differential association of individual insomnia symptoms on nutrition. Using the Health Professional Follow up Study (HPFS), the authors demonstrated difficulty maintaining sleep in relation to a greater energy intake along with an association between difficulty initiating sleep and lower overall diet quality score (29). Unlike our findings, the associations in these latter two studies were limited only to men and did not account for employment status. Although it is difficult to extract a definite conclusion from these studies, there appears to be an effect of protein intake on sleep characteristics.
There are several possible mechanisms that have been proposed to explain the association between diet quality and sleep disorders. One mechanism is that increased hunger and decreased satiety signals lead to orexigenic changes of hunger and fullness (30). Epidemiologic studies have demonstrated lower leptin and higher ghrelin levels among sleep deprived people (31, 32). Another explanation described is related to gastrointestinal discomfort from fullness making it difficult to fall or stay asleep (33). Differential impacts of these mechanisms in different study populations likely contribute to the variability in findings among studies.
Although an association between macroeconomic conditions and mortality and morbidity exists (34) (35), there is paucity of literature analyzing the effect of unemployment, dietary habits, and sleep disorders. Consistent with scant previous research, we observed poor diet quality in the face of involuntary job loss (36). The diet quality as assessed by the Healthy Eating Index (HEI) has been found to have an association with multiple chronic diseases outcomes (37). We found lower scores for HEI among women with chronic insomnia. Although we observed lower fat consumption in persons with acute insomnia, a change of macronutrient composition with an increase in high fat, high sugar, and low fruit and vegetable consumption has been described during stressful times (38)
Economic downturn has been linked with less intake of protein, saturated and total fats and more consumption of carbohydrates (36). Unemployment and financial instability have been shown to lead to unhealthy behaviors on one hand but on the other hand more time is available for healthy food preparation (39). To our knowledge, this study is unique as we examined the association between sleep disorders and diet quality in the setting of involuntary job loss.
We do acknowledge that the cross-sectional nature of this study is a limitation; therefore, we cannot determine causality. Another limitation is that the sample was comprised mainly of women and non- Hispanic whites. As previously described, employment opportunities vary by individual characteristics and particularly ethnicity, and therefore the results of this study may not be generalizable to other populations. Furthermore, persons with confirmed diagnoses of sleep disorders were excluded thus potentially limiting the population to those less impacted by any problems with their sleep. Although the DSISD has previously been validated for classifying OSA, we do acknowledge the limitation of using the structured interview as a surrogate for polysomnography.
In conclusion, the dietary intake of recently unemployed persons with insomnia or OSA is different than those without a sleep disorder. This may reflect the impact of an interaction between the effect of recent job loss and the presence of a sleep disorder on dietary habits. Future longitudinal studies of a racially and ethnically diverse population are needed to better understand the directionality/causality.
Acknowledgements
This work was supported by a grant from the National Heart, Lung and Blood Institute (HL117995).
References
- Institute of Medicine Committee on Sleep, M. and Research, The National Academies Collection: Reports funded by National Institutes of Health, in Sleep Disorders and Sleep Deprivation: An Unmet Public Health Problem, H.R. Colten and B.M. Altevogt, Editors. 2006, National Academies Press (US) Copyright © 2006, National Academy of Sciences.: Washington (DC).
- Knutson KL. Sleep duration and cardiometabolic risk: a review of the epidemiologic evidence. Best Pract Res Clin Endocrinol Metab. 2010 Oct;24(5):731-43. [CrossRef] [PubMed]
- Sagaspe P, Taillard J, Bayon V, Lagarde E, Moore N, Boussuge J, Chaumet G, Bioulac B, Philip P. Sleepiness, near-misses and driving accidents among a representative population of French drivers. J Sleep Res. 2010 Dec;19(4):578-84. [CrossRef] [PubMed]
- Gangwisch JE, Malaspina D, Boden-Albala B, Heymsfield SB. Inadequate sleep as a risk factor for obesity: analyses of the NHANES I. Sleep. 2005 Oct;28(10):1289-96. [CrossRef] [PubMed]
- Gallicchio L, Kalesan B. Sleep duration and mortality: a systematic review and meta-analysis. J Sleep Res. 2009 Jun;18(2):148-58. [CrossRef] [PubMed]
- Grandner MA, Hale L, Moore M, Patel NP. Mortality associated with short sleep duration: The evidence, the possible mechanisms, and the future. Sleep Med Rev. 2010 Jun;14(3):191-203. [CrossRef] [PubMed]
- Maeda M, Filomeno R, Kawata Y, Sato T, Maruyama K, Wada H, Ikeda A, Iso H, Tanigawa T. Association between unemployment and insomnia-related symptoms based on the Comprehensive Survey of Living Conditions: a large cross-sectional Japanese population survey. Ind Health. 2019 Nov 29;57(6):701-710. [CrossRef] [PubMed]
- Silva GE, Quan SF, McMorrow T, Bautista R, Bell ML, Haynes PL. Association between obstructive sleep apnea and multiple involuntary job loss history among recently unemployed adults. Sleep Health. 2021 Feb;7(1):118-122. [CrossRef] [PubMed]
- Batool-Anwar S, Mayer C, Haynes PL, Liu Y, Thomson CA, Quan SF. Impact of Recent Job Loss on Sleep, Energy Consumption and Diet. Southwest J Pulm Crit Care. 2021 Aug 1;23(5):129-137.[CrossRef] [PubMed]
- Haynes PL, Silva GE, Howe GW, Thomson CA, Butler EA, Quan SF, Sherrill D, Scanlon M, Rojo-Wissar DM, Gengler DN, Glickenstein DA. Longitudinal assessment of daily activity patterns on weight change after involuntary job loss: the ADAPT study protocol. BMC Public Health. 2017 Oct 10;17(1):793. [CrossRef] [PubMed]
- Vasquez MM, Goodwin JL, Drescher AA, Smith TW, Quan SF. Associations of dietary intake and physical activity with sleep disordered breathing in the Apnea Positive Pressure Long-Term Efficacy Study (APPLES). J Clin Sleep Med. 2008 Oct 15;4(5):411-8. [PubMed]
- Rock CL, Thornquist MD, Kristal AR, Patterson RE, Cooper DA, Neuhouser ML, Neumark-Sztainer D, Cheskin LJ. Demographic, dietary and lifestyle factors differentially explain variability in serum carotenoids and fat-soluble vitamins: baseline results from the sentinel site of the Olestra Post-Marketing Surveillance Study. J Nutr. 1999 Apr;129(4):855-64. [CrossRef] [PubMed]
- Bifulco A, Brown G, Edwards A, Harris T, Neilson E, Richards C, Robinson R. Life events and difficulties schedule (LEDS-2) Vol. 1: Life events manual. London, England: Royal Holloway and Bedford New College, University of London, 1989.
- Singh V, Haynes PL, Quan SF. Assessing Depression and Suicidality Among Recently Unemployed Persons with Obstructive Sleep Apnea and Socioeconomic Inequality. Southwest J Pulm Crit Care Sleep. 2022 May;24(5):81-88. [CrossRef] [PubMed]
- Subar AF, Thompson FE, Potischman N, Forsyth BH, Buday R, Richards D, McNutt S, Hull SG, Guenther PM, Schatzkin A, Baranowski T. Formative research of a quick list for an automated self-administered 24-hour dietary recall. J Am Diet Assoc. 2007 Jun;107(6):1002-7. [CrossRef] [PubMed]
- Feskanich D, Sielaff BH, Chong K, Buzzard IM. Computerized collection and analysis of dietary intake information. Comput Methods Programs Biomed. 1989 Sep;30(1):47-57. [CrossRef] [PubMed]
- Martin CK, Han H, Coulon SM, Allen HR, Champagne CM, Anton SD. A novel method to remotely measure food intake of free-living individuals in real time: the remote food photography method. Br J Nutr. 2009 Feb;101(3):446-56. [CrossRef] [PubMed]
- Edinger J, Wyatt JK. Reliability and validity of insomnia diagnoses derived from the Duke Structured Interview for Sleep Disorders [abstract]. Sleep, 2009. 32: p. A265.
- Buysse DJ, Reynolds CF 3rd, Kupfer DJ, Thorpy MJ, Bixler E, Manfredi R, Kales A, Vgontzas A, Stepanski E, Roth T, et al. Clinical diagnoses in 216 insomnia patients using the International Classification of Sleep Disorders (ICSD), DSM-IV and ICD-10 categories: a report from the APA/NIMH DSM-IV Field Trial. Sleep. 1994 Oct;17(7):630-7. [CrossRef] [PubMed]
- Silva GE, Rojo-Wissar DM, Quan SF, Haynes PL. Predictive ability of the International Classification of Sleep Disorders-3 in identifying risk of obstructive sleep apnea among recently unemployed adults. Sleep Breath. 2021 Sep;25(3):1325-1334. [CrossRef] [PubMed]
- Fenton S, Burrows TL, Skinner JA, Duncan MJ. The influence of sleep health on dietary intake: a systematic review and meta-analysis of intervention studies. J Hum Nutr Diet. 2021 Apr;34(2):273-285. [CrossRef] [PubMed]
- Katagiri R, Asakura K, Kobayashi S, Suga H, Sasaki S. Low intake of vegetables, high intake of confectionary, and unhealthy eating habits are associated with poor sleep quality among middle-aged female Japanese workers. J Occup Health. 2014;56(5):359-68. [CrossRef] [PubMed]
- Hur S, Oh B, Kim H, Kwon O. Associations of Diet Quality and Sleep Quality with Obesity. Nutrients. 2021 Sep 13;13(9):3181. [CrossRef] [PubMed]
- Bravo R, Matito S, Cubero J, Paredes SD, Franco L, Rivero M, Rodríguez AB, Barriga C. Tryptophan-enriched cereal intake improves nocturnal sleep, melatonin, serotonin, and total antioxidant capacity levels and mood in elderly humans. Age (Dordr). 2013 Aug;35(4):1277-85. [CrossRef] [PubMed]
- Duan KM, Ma JH, Wang SY, Huang Z, Zhou Y, Yu H. The role of tryptophan metabolism in postpartum depression. Metab Brain Dis. 2018 Jun;33(3):647-660. [CrossRef] [PubMed]
- Saper CB, Scammell TE, Lu J. Hypothalamic regulation of sleep and circadian rhythms. Nature. 2005 Oct 27;437(7063):1257-63. [CrossRef] [PubMed]
- Silber BY, Schmitt JA. Effects of tryptophan loading on human cognition, mood, and sleep. Neurosci Biobehav Rev. 2010 Mar;34(3):387-407. [CrossRef] [PubMed]
- Tanaka E, Yatsuya H, Uemura M, Murata C, Otsuka R, Toyoshima H, Tamakoshi K, Sasaki S, Kawaguchi L, Aoyama A. Associations of protein, fat, and carbohydrate intakes with insomnia symptoms among middle-aged Japanese workers. J Epidemiol. 2013;23(2):132-8. [CrossRef] [PubMed]
- Cheng FW, Li Y, Winkelman JW, Hu FB, Rimm EB, Gao X. Probable insomnia is associated with future total energy intake and diet quality in men. Am J Clin Nutr. 2016 Aug;104(2):462-9. [CrossRef] [PubMed]
- St-Onge MP. Sleep-obesity relation: underlying mechanisms and consequences for treatment. Obes Rev. 2017 Feb;18 Suppl 1:34-39. [CrossRef] [PubMed]
- Stern JH, Grant AS, Thomson CA, Tinker L, Hale L, Brennan KM, Woods NF, Chen Z. Short sleep duration is associated with decreased serum leptin, increased energy intake and decreased diet quality in postmenopausal women. Obesity (Silver Spring). 2014 May;22(5):E55-61. [CrossRef] [PubMed]
- Taheri S, Lin L, Austin D, Young T, Mignot E. Short sleep duration is associated with reduced leptin, elevated ghrelin, and increased body mass index. PLoS Med. 2004 Dec;1(3):e62. [CrossRef] [PubMed]
- Zuraikat FM, Makarem N, Liao M, St-Onge MP, Aggarwal B. Measures of Poor Sleep Quality Are Associated With Higher Energy Intake and Poor Diet Quality in a Diverse Sample of Women From the Go Red for Women Strategically Focused Research Network. J Am Heart Assoc. 2020 Feb 18;9(4):e014587. [CrossRef] [PubMed]
- Ruhm CJ. Are Recessions Good for Your Health? The Quarterly Journal of Economics. 2000; 115(20):617–650. [CrossRef]
- Ruhm CJ. Recessions, healthy no more? J Health Econ. 2015 Jul;42:17-28. [CrossRef] [PubMed]
- Smed S, Tetens I, Bøker Lund T, Holm L, Ljungdalh Nielsen A. The consequences of unemployment on diet composition and purchase behaviour: a longitudinal study from Denmark. Public Health Nutr. 2018 Feb;21(3):580-592. [CrossRef] [PubMed]
- Morze J, Danielewicz A, Hoffmann G, Schwingshackl L. Diet Quality as Assessed by the Healthy Eating Index, Alternate Healthy Eating Index, Dietary Approaches to Stop Hypertension Score, and Health Outcomes: A Second Update of a Systematic Review and Meta-Analysis of Cohort Studies. J Acad Nutr Diet. 2020 Dec;120(12):1998-2031.e15. [CrossRef] [PubMed]
- Habhab S, Sheldon JP, Loeb RC. The relationship between stress, dietary restraint, and food preferences in women. Appetite. 2009 Apr;52(2):437-44. [CrossRef] [PubMed]
- Burgard SA, Ailshire JA, Kalousova L, The Great Recession and health: People, populations, and disparities. The Annals of the American Academy of Political and Social Science. 2013;650(1):194-213. [CrossRef]
Assessing Depression and Suicidality Among Recently Unemployed Persons with Obstructive Sleep Apnea and Socioeconomic Inequality
Vijay Singh DO1
Patricia L. Haynes PhD2
Stuart F. Quan MD3,4
1Burrell College of Osteopathic Medicine, Las Cruces, NM
2Department of Health Promotion Sciences, Mel and Enid Zuckerman College of Public Health, University of Arizona, Tucson, AZ
3Division of Sleep and Circadian Disorders, Brigham and Women’s Hospital, Harvard Medical School, Boston, MA
4Asthma and Airway Disease Research Center, University of Arizona, Tucson, AZ
Abstract
Background: Obstructive Sleep Apnea (OSA) is a common sleep-related breathing disorder that often is associated with several psychiatric conditions. Job loss is a stressful life event that can also affect mental health and socioeconomic status (SES). We investigated whether there was an association between the prevalence of OSA and several psychiatric conditions within a cohort of persons who recently became unemployed and whether SES was a contributing factor.
Methods: Data from 292 participants who completed the screening evaluation of the Assessing Daily Activity Patterns through occupational Transitions (ADAPT) Study were used to assess the association between the prevalence of OSA, and current and past depression, and past suicidality. A type III sleep home sleep monitor was used to identify the presence of OSA and assess its severity. Depression and suicidality were ascertained using the Mini-international neuropsychiatric interview. Years of education was used as a proxy for SES.
Results: There were no significant associations between severity of OSA, SES and current depression, past depression, and suicidality. Past suicidality was noted to be more common among those who were single/widowed (17.4%) or those who were divorced or separated (11.1%) (p=0.027). Current depression was more common among Hispanics in comparison to non-Hispanics. Furthermore, prevalence rates of both depression and past suicidality were higher than previous reports in general populations.
Conclusions: Within a cohort of individuals who experienced recent job loss, there was no association between OSA and depression or past suicidality. Prevalence rates of both depression and past suicidality were higher than previous reports in the general population.
Introduction
Obstructive sleep apnea (OSA) is a highly prevalent medical condition characterized by recurrent episodes of partial or complete obstruction of the upper airways during sleep. Common symptoms are loud snoring, witnessed apneas, and daytime fatigue or sleepiness (1). It is associated with various mental health conditions such as depression, anxiety, and post-traumatic stress disorder. Importantly, recent studies with small sample sizes have shown a correlation between suicidal behavior and persons with OSA (2).
Additionally, OSA has also been shown to relate to lower socioeconomic status (SES) which can be impacted by job loss (3). However, the association of OSA, SES with mental health conditions in a population of individuals who have been recently unemployed has not adequately explored.
In this study, we evaluated the association between OSA and SES and a self-reported history of several common psychiatric disorders. We hypothesized that individuals with recent job loss and OSA would have an increased likelihood of having a history of self-reported psychiatric illness and that SES would be contributing factor.
Methods
Study participants were part of the ADAPT Study, an 18-month longitudinal study examining changes in sleep, social rhythms, and obesity following an involuntary job loss. The study protocol and recruitment strategy have been described in detail previously (4). Briefly, all individuals who applied for unemployment insurance (UI) in the greater Tucson, Arizona and surrounding areas between October 2015 and December 2018 received study recruitment flyers within their UI intake packets. Interested individuals contacted study staff and completed phone screens assessing exclusion criteria; potentially eligible individuals were then scheduled for in-person screening visits. Individuals were eligible for overnight screening if they had experienced an involuntary job loss within 90 days of study enrollment, had been with their employer for at least six months, were currently employed less than five hours per week and did not complete any night shift work within the last 30 days. During the in-person screening, participants provided written informed consent, as well as information about their demographics, employment, and medical history. They also were screened for homelessness, existing physiological and mental health conditions, substance abuse, and major sleep diagnoses which could interfere with social rhythms and sleep patterns. An overnight at-home screening for sleep apnea was performed utilizing the ApneaLink PlusTM (ResMed, San Diego, CA) to exclude moderate sleep apnea as a cause of sleep disruption. This study was approved by the University of Arizona Human Subjects Protection Program (#1401185772).
Data used in this analysis originated from the study’s screening visit. Of the 446 adults who provided written consent, 292 adult participants underwent overnight screening for obstructive sleep apnea (OSA) and completed the Mini-international neuropsychiatric interview (5). Participants were classified as having a current or past diagnosis of several mental health disorders including depression, mania, hypomania and suicidality on the basis of their responses to the structured screening interview. The screening survey also recorded information pertaining to socioeconomic status, educational attainment, race, and ethnicity. Severity of OSA was based on the Apnea-Hypopnea Index (AHI) from the home sleep study as follows: No OSA (AHI <5 /h), Mild OSA (AHI ≥5 and <15 /h), Moderate to Severe OSA (AHI ≥15 /h). Primary dichotomous endpoints included percent of people who had past or current episodes of depression, and past episodes of suicidality. Income in relation to the US Health and Human Services Poverty Line for Arizona was used as an indicator of SES based on data from the baseline survey.
Statistical Analysis. Mean and standard deviation for the variables being investigated were used to describe the baseline characteristics of the cohort. Comparison of the prevalence of various mental health conditions as a function of the presence of OSA was performed using a Pearson-Chi Square test. Comparisons of the prevalence of depression and suicidality to previously reported prevalence rates were completed using the binomial test. All statistical analyses were done using IBM SPSS version 28 (Armonk, NY).
Results
Table 1 describes the overall demographic and baseline characteristics for the participants who volunteered to be a part of the survey.
 (Click here to view Table 1 in a separate, enlarged window)
Most participants were White and 35.3% were Hispanic. The majority were women and were not married or had a live-in partner. A majority were living at or below the poverty line and two-thirds had a high school education or less. On average, the population being studied was obese. Moderate to severe OSA was observed in 48 participants (16.4%). Screening for mental health conditions showed that approximately one-third of the cohort had self-reported current as well as past depression. Both current and past depression rates are significantly higher (binomial test, p<0.001) than the 8.1% prevalence of depression reported from the 2013-2016 National Health and Nutrition Examination Survey (NHANES) (6). History of suicidality was present in approximately 11% of the sample. This rate is higher than the 4.2% prevalence of suicidal thoughts in Arizona reported by the National Survey on Drug Use and Health in 2008-2009 (7)(binomial test, p<0.001). The remaining health conditions were observed in very small numbers and were not analyzed further.
Table 2 shows relationships between severity of AHI and marital status, educational attainment, race, and socioeconomic status. No significant associations were observed.
 (Click here to view Table 2 in a separate, enlarged window)
Shown in Table 3 are the associations of severity of OSA, social and demographic characteristics of the participants with current and past episodes of depression.
 (Click here to view Table 3 in a separate, enlarged window)
There were no significant associations with respect to self-reported current or past depression with any demographic characteristics or severity of OSA.
The associations between severity of OSA and demographic characteristics with a history of self-reported past suicidality are shown in Table 4.
 (Click here to view Table 4 in a separate, enlarged window)
Past suicidality was least likely to have occurred among those who were married or had a live-in partner (6.6%) in comparison to those who were single/widowed (17.4%) or those who were divorced or separated (11.1%) (p=0.027). No other significant relationships were found between these demographic factors as well as history of OSA.
Discussion
In this study of recently unemployed adults, we did not find any associations between OSA or SES with the prevalence of self-reported depression (past or current) or past suicidality. However, the prevalence rates for depression were higher in this cohort in comparison to previous reports in the general population particularly among Hispanics. History of suicidality was also higher than reported in the general Arizona population and was observed to be more common among those who were not married or living with a partner.
Although we were unable to find any associations between OSA and psychiatric conditions in our study, most but not all previous literature has found correlations between OSA and patients suffering from depression (8, 9). There are many similarities between OSA and depression including symptoms such as poor sleep, anhedonia, low energy, and lack of concentration (10). It is unclear why our results do not confirm previous findings of a close relationship. However, our cohort had relatively few participants with severe OSA, as compared to samples from sleep centers. It is possible that depressive symptoms are correlated with the AHI only in severe OSA (Lee 2015). Additionally, although most individuals in the study were female who are more likely to have major depression (11), the prevalence of OSA is higher in males (12). Thus, the ability to detect an association between depression and OSA may be low. Furthermore, the prevalence of current (30.2% Male/34.3% Female) and past depression (32.5% Male/42.8% Female) was already high in our cohort of recently unemployed persons in comparison to estimates of the overall prevalence before the COVID-19 pandemic of ~8% (6, 13). Thus, it is possible that any additional impact of OSA would be difficult to detect.
Increased rates of depression have been previously reported among unemployed adults (14). We also found an elevated rate of depression among unemployed persons, but extend these findings to specifically those with recent job loss. Although our depression prevalence rate was higher than previously observed (14), this comparison should be interpreted cautiously given the dissimilarities in ascertainment instruments. It might be surmised that recent job loss is the most plausible explanation for high rates of current depression in this cohort, but it is unclear why the prevalence of past depression also is high. One explanation is that history of depression is a marker for subsequent unemployment as has been previously suggested (15). Irrespective of etiology, our results indicate that recently unemployed persons are at high risk for mental health issues.
Hispanics in our study had higher rates of current depression than non-Hispanics. In a review of depression in Hispanics in the United States, Lewis-Fernandez et al (16) noted that initial studies found that Hispanic populations have higher rates of depression than primarily white populations, but that this was not confirmed in later studies. Hispanics are a heterogenous ethnic group and are primarily of Mexican ancestry in Arizona. In their review, Lewis-Fernandez et al (16) noted that United States-born Mexican Americans had higher rates of depression than those born in Mexico. Although ability to speak English was an inclusion requirement for participation, we could not precisely determine the geographic origin of the Hispanics in this cohort. Thus, the explanation for our finding of higher depression rates in Hispanics remains unclear.
Our study did not find an association between OSA and past suicidality. In contrast, a recent large Danish cohort study of 48,168 patients with OSA found an increased risk of suicide as well as self-harm (17). It is likely that we were underpowered to detect any relationship, since only 33 participants reported past suicide. However, we did find a history of suicidality to be greater in those were single or widowed. This is consistent with previous studies demonstrating suicide rates are higher amongst those who are not married (18). Our data provide additional evidence showing that suicidality is more common among individuals who do not cohabitate.
Similar to our findings related to the prevalence of depression, the past suicidality rate in our cohort was higher than reported in general populations (2, 7, 19). This is most likely related to higher rates of past depression in our cohort.
Lower SES has been associated with a higher occurrence of psychiatric co-morbidities. Patients with lower SES have been noted to have a greater likelihood of developing chronic mental health conditions, particularly depression (20). Studies of OSA and health disparities have demonstrated a higher prevalence of OSA among those who are disadvantaged (21). Although a majority of the cohort had incomes below the poverty line, this status may have been a recent event associated with job loss and therefore not sufficiently impactful to increase the prevalence of OSA.
Our study has several strengths. We assessed a moderate sized cohort consisting of 292 individuals, 126 of which were of the male gender. This allowed us to have a nearly balanced analysis of both male and female genders. Moreover, it is unique in that we explored associations of OSA and mental health among those who were recently unemployed. However, there are some limitations. In particular, our cohort does not reflect the ethnic distribution of the general US population. Approximately one-third of the cohort was Hispanic which is approximately twice the proportion in the US, but nevertheless reflects the ethnic composition of Tucson, AZ. In addition, the relative paucity of persons with severe OSA may have limited our power to detect significant associations.
In conclusion, in this study, we did not find any notable relationships between OSA, SES and depression and past suicidality in those who were recently unemployed although rates of both conditions were higher than previously reported in the general population. Further studies will need to be undertaken with a larger more diverse population to ascertain to confirm these findings.
References
- Young T, Palta M, Dempsey J, Skatrud J, Weber S, Badr S. The occurrence of sleep-disordered breathing among middle-aged adults. N Engl J Med. 1993 Apr 29;328(17):1230-5. [CrossRef] [PubMed]
- Choi SJ, Joo EY, Lee YJ, Hong SB. Suicidal ideation and insomnia symptoms in subjects with obstructive sleep apnea syndrome. Sleep Med. 2015 Sep;16(9):1146-50. [CrossRef] [PubMed]
- Guglielmi O, Lanteri P, Garbarino S. Association between socioeconomic status, belonging to an ethnic minority and obstructive sleep apnea: a systematic review of the literature. Sleep Med. 2019 May;57:100-106. [CrossRef] [PubMed]
- Haynes PL, Silva GE, Howe GW, Thomson CA, Butler EA, Quan SF, Sherrill D, Scanlon M, Rojo-Wissar DM, Gengler DN, Glickenstein DA. Longitudinal assessment of daily activity patterns on weight change after involuntary job loss: the ADAPT study protocol. BMC Public Health. 2017 Oct 10;17(1):793. [CrossRef] [PubMed]
- Sheehan DV, Lecrubier Y, Sheehan KH, Amorim P, Janavs J, Weiller E, Hergueta T, Baker R, Dunbar GC. The Mini-International Neuropsychiatric Interview (M.I.N.I.): the development and validation of a structured diagnostic psychiatric interview for DSM-IV and ICD-10. J Clin Psychiatry. 1998;59 Suppl 20:22-33;quiz 34-57. [PubMed]
- Brody DJ, Pratt LA, Hughes JP. Prevalence of Depression Among Adults Aged 20 and Over: United States, 2013-2016. NCHS Data Brief. 2018 Feb;(303):1-8. [PubMed]
- Crosby AE, Han B, Ortega LA, Parks SE, Gfroerer J; Centers for Disease Control and Prevention (CDC). Suicidal thoughts and behaviors among adults aged ≥18 years--United States, 2008-2009. MMWR Surveill Summ. 2011 Oct 21;60(13):1-22. [PubMed]
- Ejaz SM, Khawaja IS, Bhatia S, Hurwitz TD. Obstructive sleep apnea and depression: a review. Innov Clin Neurosci. 2011 Aug;8(8):17-25. [PubMed]
- Hobzova M, Prasko J, Vanek J, Ociskova M, Genzor S, Holubova M, Grambal A, Latalova K. Depression and obstructive sleep apnea. Neuro Endocrinol Lett. 2017 Oct;38(5):343-352. [PubMed]
- Jehan S, Auguste E, Pandi-Perumal SR, Kalinowski J, Myers AK, Zizi F, Rajanna MG, Jean-Louis G, McFarlane SI. Depression, Obstructive Sleep Apnea and Psychosocial Health. Sleep Med Disord. 2017;1(3):00012. Epub 2017 Oct 27. [PubMed]
- Albert PR. Why is depression more prevalent in women? J Psychiatry Neurosci. 2015 Jul;40(4):219-21. [CrossRef] [PubMed]
- Vanek J, Prasko J, Genzor S, Ociskova M, Kantor K, Holubova M, Slepecky M, Nesnidal V, Kolek A, Sova M. Obstructive sleep apnea, depression and cognitive impairment. Sleep Med. 2020 Aug;72:50-58. [CrossRef] [PubMed]
- Cao C, Hu L, Xu T, Liu Q, Koyanagi A, Yang L, Carvalho AF, Cavazos-Rehg PA, Smith L. Prevalence, correlates and misperception of depression symptoms in the United States, NHANES 2015-2018. J Affect Disord. 2020 May 15;269:51-57. [CrossRef] [PubMed]
- Gallup Inc. In U.S., Depression Rates Higher for Long-Term Unemployed. Gallup.com 2014. Available at https://news.gallup.com/poll/171044/depression-rates-higher-among-long-term-unemployed.aspx (accessed 5/16/22).
- Andreeva E, Magnusson Hanson LL, Westerlund H, Theorell T, Brenner MH. Depressive symptoms as a cause and effect of job loss in men and women: evidence in the context of organisational downsizing from the Swedish Longitudinal Occupational Survey of Health. BMC Public Health. 2015 Oct 12;15:1045. [CrossRef] [PubMed]
- Lewis-Fernández R, Das AK, Alfonso C, Weissman MM, Olfson M. Depression in US Hispanics: diagnostic and management considerations in family practice. J Am Board Fam Pract. 2005 Jul-Aug;18(4):282-96. [CrossRef] [PubMed]
- Udholm N, Fuglsang M, Lundbye-Christensen S, Bille J, Udholm S. Obstructive sleep apnea and risk of suicide and self-harm: a Danish Nationwide Cohort Study. Sleep. 2022 Feb 14;45(2):zsab286. [CrossRef] [PubMed]
- Mastekaasa A. Age variations in the suicide rates and self-reported subjective well-being of married and never married persons. J Community Appl Soc Psychol 1995;5:21–39. [CrossRef]
- Kessler RC, Berglund P, Borges G, Nock M, Wang PS. Trends in suicide ideation, plans, gestures, and attempts in the United States, 1990-1992 to 2001-2003. JAMA. 2005 May 25;293(20):2487-95. [CrossRef] [PubMed]
- Lorant V, Deliège D, Eaton W, Robert A, Philippot P, Ansseau M. Socioeconomic inequalities in depression: a meta-analysis. Am J Epidemiol. 2003 Jan 15;157(2):98-112. [CrossRef] [PubMed]
- Etindele Sosso FA, Matos E. Socioeconomic disparities in obstructive sleep apnea: a systematic review of empirical research. Sleep Breath. 2021 Dec;25(4):1729-1739. [CrossRef] [PubMed]
Acknowledgements
This research was supported by the National Heart, Lung, and Blood Institute (#1R01HL117995-01A1; PI: Haynes).
Cite as: Singh V, Haynes PL, Quan SF. Assessing Depression and Suicidality Among Recently Unemployed Persons with Obstructive Sleep Apnea and Socioeconomic Inequality. Southwest J Pulm Crit Care Sleep. 2022;24(5):81-88. doi: https://doi.org/10.13175/swjpccs020-22 PDF
Long-term All-Cause Mortality Risk in Obstructive Sleep Apnea Using Hypopneas Defined by a ≥3 Percent Oxygen Desaturation or Arousal
Rohit Budhiraja, MD1
Stuart F. Quan, MD1,2
1Division of Sleep and Circadian Disorders, Brigham and Women’s Hospital, Boston, MA
2Arizona Asthma and Airways Research Center, University of Arizona College of Medicine, Tucson, AZ
Abstract
Study Objectives: Some prior studies have demonstrated an increase in mortality associated with obstructive sleep apnea (OSA) utilizing a definition of OSA that requires a minimum 4% oxygen desaturation to identify a hypopnea. No large community-based studies have determined the risk of long-term mortality with OSA with hypopneas defined by a ≥3% O2 desaturation or arousal (AHI3%A).
Methods: Data from 5591 Sleep Heart Health Study participants without prevalent cardiovascular disease at baseline who underwent polysomnography were analyzed regarding OSA diagnosed using the AHI3%A criteria and all-cause mortality over a mean follow up period of 10.9±3.2 years.
Results: There were 1050 deaths in this group during the follow-up period. A Kaplan-Meir plot of survival revealed a reduction in survival with increasing AHI severity. Cox proportional hazards regression models revealed significantly increased all-cause mortality risk with increasing AHI, hazard ratio (HR, 95% CI) 1.13 (1.04-1.23), after adjusting for age, sex, race, BMI, cholesterol, HDL, self-reported hypertension and/or diabetes and smoking status. In categorical models, the mortality risk was significantly higher with severe OSA [adjusted HR 1.38 (1.09-1.76)]. When stratified by gender or age, severe OSA was associated with increased risk of death in men [adjusted HR 1.14 (1.01-1.28)] and in those <70 years of age [adjusted HR 1.51 (1.02-2.26)]. In contrast, AHI severity was not associated with increased mortality in women or those ≥70 years of age in fully adjusted models.
Conclusion: Severe AHI3%A OSA is associated with significantly increased mortality risk, especially in men and those <70 years of age.
Introduction
Obstructive sleep apnea (OSA) is a prevalent disorder associated with diverse physiological changes. Intermittent hypoxia-reoxygenation, sympathetic nervous system activation and endothelial dysfunction have been demonstrated in OSA and likely contribute to adverse outcomes including daytime sleepiness, hypertension, coronary artery disease, and stroke (1,2). It is also associated with increased mortality, especially in those with more severe disease (3-7).
The severity of OSA is most frequently categorized using the apnea hypopnea index (AHI). However, the definition of the ‘hypopnea’ component of this index remains a matter of controversy. American Academy of Sleep Medicine (AASM) guidelines recommend that hypopnea be defined as a 30% or greater reduction in the airflow associated with either ≥3% decrease in oxyhemoglobin saturation, or an arousal from sleep (AHI3%A) (8). However, Centers for Medicare and Medicaid Services (CMS), along with several other payors in the United States, utilize an alternate hypopnea definition that requires at least a 4% desaturation and does not recognize arousals for defining hypopnea (AHI4%). The reimbursement for OSA therapy from these payors is reserved for the subset of patients that meets this more stringent definition of OSA. Unfortunately, this policy systematically deprives some patients, even those with clear symptoms attributable to sleep apnea such as increased sleepiness, of appropriate therapy, since they do not meet the higher diagnostic cutoff mandated by this definition.
Much of the current status quo may be related to a lack of substantial data evaluating the impact of hypopnea events associated with less severe desaturation or arousals on diverse OSA outcomes. In contrast, several large cohort studies have established a robust relationship between OSA defined using the AHI4% definition and cardiovascular outcomes (9-11). Two large community-based longitudinal studies demonstrating an association between OSA severity and all-cause mortality, that from Sleep Heart Health Study (SHHS) cohort (3) and that from Wisconsin Sleep Cohort (5), also utilized the AHI4% definition. However, no large community-based longitudinal studies have assessed the association between OSA diagnosed using the AHI3%A definition and mortality. The current study utilized data from SHHS to assess the relationship between OSA defined by the AHI3%A at baseline and all-cause mortality over an 11-year follow up period.
Methods
Participants
The Sleep Heart Health Study (SHHS) was a multicenter cohort study that investigated prospectively the relationship between OSA and cardiovascular diseases in the United States. Details of the rationale and study design have been described elsewhere (12). Recruitment began in 1995 with eventual enrollment of 6,441 participants, 40 years of age and older, from several ongoing “parent” cardiovascular and respiratory disease cohorts who were initially assembled between 1976 and 1995 (13). These “parent” cohorts consisted of the Offspring and the Omni Cohorts of the Framingham Heart Study in Massachusetts; the Hagerstown, MD, and Minneapolis, MN, sites of the Atherosclerosis Risk in Communities Study; the Hagerstown, MD, Pittsburgh, PA, and Sacramento, CA, sites of the Cardiovascular Health Study; 3 hypertension cohorts (Clinic, Worksite, and Menopause) in New York City; the Tucson Epidemiologic Study of Airways Obstructive Diseases and the Health and Environment Study; and the Strong Heart Study of American Indians in Oklahoma, Arizona, North Dakota, and South Dakota. Between 1995 and 1997, these participants underwent a home sleep evaluation that included full unattended polysomnography to determine whether they had OSA. Subsequently, they were followed for mortal events by their parent cohorts. Follow-up duration was 10.9±3.2 years (Mean±SD). As shown in Figure 1, consent was withdrawn by 134 participants from the Arizona cohort of the Strong Heart Study because of sovereignty issues after the end of the follow-up period.

Figure 1. Diagram of Sleep Heart Health Study (SHHS) analytic cohort.
Participants with self-reported prevalent cardiovascular disease (CVD: coronary heart disease, stroke or congestive heart failure) at enrollment also were excluded. Consequently, there were 5,591 participants in the analytic cohort. Parent cohort data were used for documentation of age, height, sex and ethnicity. Co-morbid self-reported diabetes, cardiovascular disease (CVD), concurrent treatment for OSA and smoking status were ascertained from parent cohort data or from responses on health interview and sleep habit questionnaires administered on the evening of the polysomnography home visit (vide infra). Hypertension status was derived as previously described from blood pressure measurements on the night of the home visit and hypertensive medication use (14). Body mass index (BMI) was calculated as weight (kg)/height (m2).
Institutional review boards for human subjects’ research of the respective parent cohorts approved the study. Informed written consent was obtained from all participants at the time of their recruitment.
Polysomnography and Home Visit
Participants underwent overnight in-home polysomnograms using the Compumedics Portable PS-2 System (Abbottsville, Victoria, Australia) administered by trained technicians (15). The home visits were performed by two-person, mixed-sex teams in visits that lasted 1.5 to 2 hours. At the time of the home visit, blood pressure was measured manually in triplicate in a seated position after 5 minutes of rest (16). The average of the second and third measurements was used. Body weight was measured using a digital scale.
The SHHS recording montage for both the initial and follow-up sleep evaluations consisted of electroencephalogram (C4/A1 and C3/A2), right and left electrooculogram, a bipolar submental electromyogram, thoracic and abdominal excursions (inductive plethysmography bands), airflow (detected by a nasal-oral thermocouple [Protec, Woodinville, WA]), oximetry (finger pulse oximetry [Nonin, Minneapolis, MN]), electrocardiogram and heart rate (using a bipolar electrocardiogram lead), body position (using a mercury gauge sensor), and ambient light (on/off, by a light sensor secured to the recording garment). Equipment and sensors were applied and calibrated during the evening home visit by a study certified technician. In the morning, the equipment and the data stored in real time on PCMCIA cards, were retrieved and downloaded to the computers of each respective clinical site. The data were locally reviewed, and then forwarded to a central reading center (Case Western Reserve University, Cleveland, OH). Comprehensive descriptions of polysomnography scoring and quality-assurance procedures have been previously published (15,17). In brief, sleep was scored according to guidelines developed by Rechtschaffen and Kales (18). Strict protocols were maintained to ensure comparability among centers and technicians. Intra-scorer and inter-scorer reliabilities were high (17).
The apnea hypopnea index (AHI) was calculated for each participant using the AASM recommended definition of hypopnea. Thus, hypopneas were identified if the amplitude of a measure of flow or volume (detected by the thermocouple or thorax or abdominal inductance band signals) was reduced discernibly (at least 25% lower than baseline breathing) for at least 10 seconds, did not meet the criteria for apnea and the event was associated with either a ≥3% oxygen desaturation from baseline or terminated with electroencephalographic evidence of an arousal. An apnea was defined as a complete or almost complete cessation of airflow, as measured by the amplitude of the thermocouple signal, lasting at least 10 seconds.
Statistical Analyses
Mean and standard deviation were used to provide an overall description of the data used in the analyses. For analyses using the AHI, each participant’s AHI was assigned to one of 4 OSA severity categories: No OSA (AHI <5 /hour), Mild (AHI ≥5 and <15 /hour), Moderate (AHI ≥15 and < 30/hour) and Severe (AHI ≥30). For some analyses, because values for AHI were extremely left skewed, a natural log transformation was performed to express AHI as a continuous factor in the form of lnAHI+0.1. To nullify the impact of 0 values of the AHI, 0.1 was added to the ln function. Mortality rates were computed by dividing the number of deaths by accumulated person-years at risk.
Analysis of variance was used to test for differences within continuous variables and 2 was employed for categorial variables. A Kaplan-Meir plot was computed to assess the overall relationship between severity of OSA and mortality. Cox proportional hazards regression models were calculated to examine the association between AHI as a categorical and continuous factor and mortality. Covariates included in the models were sex, race, age, BMI, cholesterol, high density lipoprotein (HDL), hypertension and/or diabetes and smoking status. Consistent with a previous study assessing mortality in SHHS, age was dichotomized into those <70 and those ≥ 70 years (3). Race was stratified as non-Hispanic White or other. Smoking was recategorized into those who were current or former smokers and those who were never smokers. Prevalent hypertension or self-reported diabetes was expressed as present or absent. Three models were constructed: Model 1 adjusted for age, race and sex, Model 2 adjusted for covariates in Model 1 plus BMI and Model 3 adjusted for covariates in Models 1 and 2 plus cholesterol, HDL, hypertension/diabetes and smoking status.
Analyses were performed using IBM SPSS Statistics v27 (Armonk, NY). The survival package in R was used to obtain the Kaplan Meir plot. A p value of <0.05 was considered statistically significant.
Results
Demographic and clinical characteristics of the cohort stratified by AHI are shown in Table 1.
Table 1. Baseline Characteristics Stratified by Apnea Hypopnea Indexa,b

Age and BMI increased across AHI strata as well as the % of men, current/ex-smokers, diabetic/hypertensives and non-Hispanic Whites. In contrast, HDL decreased. No changes were observed for cholesterol or % receiving OSA treatment.
Figure 2 depicts the Kaplan-Meir plot of survival over ~11 years of follow-up stratified by AHI categories.

Figure 2. Kaplan Meir plot of survival stratified by apnea hypopnea (AHI) severity.
There was a clear reduction in survival with apparent differences related to AHI severity. However, because several covariates also impacted survival across AHI strata, multivariate proportional hazard modelling was employed as shown in for all participants as shown in Table 2.
Table 2. Hazard Ratios (95% confidence intervals) for All-Cause Mortality

There were 1,050 deaths with full covariate data available for analysis. For the categorical modelling, there was an increase in the hazard ratio as the AHI severity increased, but this was only statistically significant at an AHI ≥30 /h (HR: 1.36, 95% CI: 1.09-1.69). Increasing model complexity did not alter this finding. A model using AHI as a continuous factor also demonstrated a significant association between severity of AHI and increasing mortality in a fully adjusted model. A sensitivity analysis where concurrent OSA treatment was included also did not change this relationship.
Because previous analyses have demonstrated differences in mortality between men and women, sex stratified analyses were performed as shown in Table 3.
Table 3. Hazard Ratios (95% confidence intervals) for All-Cause Mortality Stratified by Sex

These findings confirmed that in men AHI severity in both categorical and continuous analyses was associated with increased mortality. As observed in the combined analyses, this was only statistically significant in the continuous analysis (HR: 1.14, 95% CI: 1.01-1.28) although strong trends were noted in the categorical analyses in all models. In women, however, the relationship between AHI severity and mortality was less robust. In demographic (Model 1) and demographic/anthropometric (Model 2) adjusted analyses, an AHI ≥30 /h was associated with increased mortality, but this observation was attenuated and lost statistical significance in the fully adjusted categorical and continuous models.
Table 4 shows age stratified analyses comparing those <70 years to those ≥70 years of age.
Table 4. Hazard Ratios (95% confidence intervals) for All-Cause Mortality Stratified by Age at 70 years

In those who were <70 years, AHI severity was strongly associated with increased mortality. Although this finding was statistically significant only at AHI ≥30 /h in the fully adjusted model, it was significant at AHI 15-29.9/h in less complex models (HR: 1.45, 95% CI: 1.03-2.04) and approached significance in the fully adjusted model (HR: 1.41, 95% CI: 0.98-2.00). In contrast, AHI severity was not found to be associated with increased mortality among those ≥70 years of age in either categorial or continuous models.
Of the 1,050 deaths used in the proportional hazard models, 258 (24.7%) were classified as related to CVD. In analyses restricted to CVD deaths, a Kaplan-Meir plot (not shown) indicated a reduction in survival with increasing OSA severity (Log Rank 2 = 11.2-20.4 for comparisons vs. AHI <5 /h, p<.001). However, in fully adjusted proportional hazard models, no differences in survival attributable to OSA were observed.
Discussion
The current study demonstrated using the AHI3%A definition of hypopnea, a significant association between increasing severity of AHI and all-cause mortality in a model adjusted for relevant anthropometric and demographic factors and clinical co-morbidities. In stratified analyses, this association was more robust among men than in women, and those below 70 years of age compared to the older subjects.
Notably, some earlier studies have demonstrated an increase in mortality associated with OSA. An 18-year follow-up from Wisconsin cohort revealed a significantly increased hazard ratio for all-cause mortality and cardiovascular mortality in severe OSA (5). Punjabi et al. (3) used data from SHHS and demonstrated an increase in all-cause mortality with severe OSA, particularly in men aged 40–70, during an average follow-up period of 8.2 years. Both these studies utilized the AHI4% criteria for OSA diagnosis. Similarly, Martínez-García (19) utilized AHI4% criteria in a clinic population of 939 elderly (median follow-up, 69 months) and found HR of 2.25 for cardiovascular mortality in the untreated severe OSA group. A study from Denmark included 22,135 OSA patients found that male gender, age>40 years, diabetes (types 1 and 2), hypertension, and heart failure were associated with greater mortality (criteria for hypopnea not specified (6). Marin et al. (10) also noted increased fatal and non-fatal cardiovascular events in men with untreated severe OSA diagnosed using the AHI4% criteria during a mean 10.1 years follow-up period. A meta-analysis with 11,932 patients from 6 prospective observational studies found severe OSA to be a strong independent predictor for cardiovascular and all-cause mortality (4). Finally, a meta-analysis of 27 cohort studies included 3,162,083 participants showed higher all-cause mortality in severe OSA and lower mortality in CPAP-treated than in untreated patients (7). Virtually all of these aforementioned studies utilized a definition of OSA requiring a minimum 4% oxygen desaturation to identify a hypopnea.
To our knowledge, our study is the first large community-based study to assess the association between OSA diagnosed using the AHI3%A criteria and mortality. Severe OSA was associated with a higher mortality, especially in those <70 years of age, and in men. Consistent with our findings, an earlier study in a clinical population of over 10,000 adults observed OSA diagnosed utilizing AHI3%A criteria predicted incident sudden cardiac death (20). The higher mortality risk in men and in younger people is similar to that reported in other analyses from this database using AHI4% criteria (3,21). Our results provide evidence that the more liberal AHI3%A criteria is associated with increased all-cause mortality thus providing further justification for its use in identifying persons with OSA who may benefit from treatment.
We observed that approximately 25% of the deaths in our analytic cohort were attributable to CVD. Data from the Wisconsin Sleep Cohort indicate that excess mortality associated with OSA over a 18 year follow-up is partially related to CVD (5). Our unadjusted analyses are consistent with this observation. However, our study did not have sufficient power in adjusted models to replicate it.
There are several factors that could explain the association between OSA and increased mortality. OSA increases the risk for hypertension, cardiovascular disease, diabetes, and stroke and can, thus, increase mortality. Hypoxemic burden has been suggested to be a conspicuous factor conferring an increased mortality risk (22). Other factors, however, may also play a notable role. Analyses from 5,712 participants revealed that short respiratory event duration, a marker for low arousal threshold, was associated with higher mortality risk (21). The authors hypothesized that the shorter event duration reflected greater “arousability”, resulting in greater sleep fragmentation, shorter sleep, and excess sympathetic tone, and hence increased mortality. Arousals are associated with an increase in the sympathetic activity and a decrease in the parasympathetic activity and data support their role in the development of hypertension.
From a clinical perspective, utilizing the AHI4% criteria in lieu of AHI3%A to identify persons as having OSA impacts those who are classified as having OSA by the latter standard, but not the former. Using the SHHS database, we found that 36.1% of individuals fall into this category. Importantly, similar to persons who were classified as having OSA by both criteria, we observed that this group who were designated as having OSA by only AHI3%A criteria had increased rates of prevalent and incident hypertension (23,24). There also was a significant association with CVD (25). Combined with these previous studies, the current analyses demonstrating increased mortality associated with OSA defined by AHI3%A criteria provide evidence that use of this more liberal definition will benefit patients.
This study has several strengths. SHHS is large, ethnically diverse cohort, making the results more generalizable. The cohorts were community-based, obviating any referral bias. Polysomnography, the gold standard diagnostic test for OSA, was performed on all individuals. The substantive database allowed controlling for multiple confounders. Finally, the participants were followed for an ample time with the average follow-up period of 11 years.
The study also has some limitations. First, being a community derived cohort, the severity of OSA seen in SHHS was generally mild to moderate. The outcomes, including mortality, would be expected to be worse in a clinical cohort with higher severity of sleep apnea. Secondly, while the current study included a substantial number of potential covariates in the models, residual confounding from other factors may have occurred. Thirdly, the severity of OSA may have changed over the follow up period. Fourthly, while the follow-up period of the study was long, it is possible that an even longer follow-up period may have allowed a better estimate of the long-term impact of OSA on mortality. Finally, although the study demonstrated increased mortality risk, elucidation of the mechanisms thereof was beyond the scope of this study.
In conclusion, the current study demonstrated in a large community-based cohort that even OSA defined by a more liberal AHI3%A is associated with increased mortality. Considering the adverse outcomes associated with OSA, a restrictive definition that excludes these persons from warranted OSA therapy is potentially deleterious to overall health with significant individual and healthcare implications.
References
- Javaheri S, Barbe F, Campos-Rodriguez F, et al. Sleep Apnea: Types, Mechanisms, and Clinical Cardiovascular Consequences. J Am Coll Cardiol. 2017 Feb 21;69(7):841-858. [CrossRef] [PubMed]
- Budhiraja R, Parthasarathy S, Quan SF. Endothelial dysfunction in obstructive sleep apnea. J Clin Sleep Med. 2007 Jun 15;3(4):409-15. [PubMed]
- Punjabi NM, Caffo BS, Goodwin JL, Gottlieb DJ, Newman AB, O'Connor GT, Rapoport DM, Redline S, Resnick HE, Robbins JA, Shahar E, Unruh ML, Samet JM. Sleep-disordered breathing and mortality: a prospective cohort study. PLoS Med. 2009 Aug;6(8):e1000132. [CrossRef] [PubMed]
- Ge X, Han F, Huang Y, Zhang Y, Yang T, Bai C, Guo X. Is obstructive sleep apnea associated with cardiovascular and all-cause mortality? PLoS One. 2013 Jul 25;8(7):e69432. [CrossRef] [PubMed]
- Young T, Finn L, Peppard PE, Szklo-Coxe M, Austin D, Nieto FJ, Stubbs R, Hla KM. Sleep disordered breathing and mortality: eighteen-year follow-up of the Wisconsin sleep cohort. Sleep. 2008 Aug;31(8):1071-8. [PubMed]
- Jennum P, Tønnesen P, Ibsen R, Kjellberg J. Obstructive sleep apnea: effect of comorbidities and positive airway pressure on all-cause mortality. Sleep Med. 2017 Aug;36:62-66. [CrossRef] [PubMed]
- Fu Y, Xia Y, Yi H, Xu H, Guan J, Yin S. Meta-analysis of all-cause and cardiovascular mortality in obstructive sleep apnea with or without continuous positive airway pressure treatment. Sleep Breath. 2017 Mar;21(1):181-189. [CrossRef] [PubMed]
- Berry RB, Budhiraja R, Gottlieb DJ, et al. Rules for scoring respiratory events in sleep: update of the 2007 AASM Manual for the Scoring of Sleep and Associated Events. Deliberations of the Sleep Apnea Definitions Task Force of the American Academy of Sleep Medicine. J Clin Sleep Med. 2012 Oct 15;8(5):597-619. [CrossRef] [PubMed]
- Gottlieb DJ, Yenokyan G, Newman AB, O'Connor GT, Punjabi NM, Quan SF, Redline S, Resnick HE, Tong EK, Diener-West M, Shahar E. Prospective study of obstructive sleep apnea and incident coronary heart disease and heart failure: the sleep heart health study. Circulation. 2010 Jul 27;122(4):352-60. [CrossRef] [PubMed]
- Marin JM, Carrizo SJ, Vicente E, Agusti AG. Long-term cardiovascular outcomes in men with obstructive sleep apnoea-hypopnoea with or without treatment with continuous positive airway pressure: an observational study. Lancet. 2005 Mar 19-25;365(9464):1046-53. [CrossRef] [PubMed]
- Peppard PE, Young T, Palta M, Skatrud J. Prospective study of the association between sleep-disordered breathing and hypertension. N Engl J Med. 2000 May 11;342(19):1378-84. [CrossRef] [PubMed]
- Quan SF, Howard BV, Iber C, et al. The Sleep Heart Health Study: design, rationale, and methods. Sleep. 1997 Dec;20(12):1077-85. [PubMed]
- Lind BK, Goodwin JL, Hill JG, Ali T, Redline S, Quan SF. Recruitment of healthy adults into a study of overnight sleep monitoring in the home: experience of the Sleep Heart Health Study. Sleep Breath. 2003 Mar;7(1):13-24. [CrossRef] [PubMed]
- Nieto FJ, Young TB, Lind BK, Shahar E, Samet JM, Redline S, D'Agostino RB, Newman AB, Lebowitz MD, Pickering TG. Association of sleep-disordered breathing, sleep apnea, and hypertension in a large community-based study. Sleep Heart Health Study. JAMA. 2000 Apr 12;283(14):1829-36. [CrossRef] [PubMed]
- Redline S, Sanders MH, Lind BK, Quan SF, Iber C, Gottlieb DJ, Bonekat WH, Rapoport DM, Smith PL, Kiley JP. Methods for obtaining and analyzing unattended polysomnography data for a multicenter study. Sleep Heart Health Research Group. Sleep. 1998 Nov 1;21(7):759-67. [PubMed]
- O'Connor GT, Caffo B, Newman AB, Quan SF, Rapoport DM, Redline S, Resnick HE, Samet J, Shahar E. Prospective study of sleep-disordered breathing and hypertension: the Sleep Heart Health Study. Am J Respir Crit Care Med. 2009 Jun 15;179(12):1159-64. [CrossRef] [PubMed]
- Whitney CW, Gottlieb DJ, Redline S, Norman RG, Dodge RR, Shahar E, Surovec S, Nieto FJ. Reliability of scoring respiratory disturbance indices and sleep staging. Sleep. 1998 Nov 1;21(7):749-57. [CrossRef] [PubMed]
- Rechtschaffen A. A manual for standardized terminology, techniques and scoring system for sleep stages in human subjects. Brain information service. Washington, DC : United States Government Printing Office, 1968.
- Martínez-García MA, Campos-Rodríguez F, Catalán-Serra P, Soler-Cataluña JJ, Almeida-Gonzalez C, De la Cruz Morón I, Durán-Cantolla J, Montserrat JM. Cardiovascular mortality in obstructive sleep apnea in the elderly: role of long-term continuous positive airway pressure treatment: a prospective observational study. Am J Respir Crit Care Med. 2012 Nov 1;186(9):909-16. [CrossRef] [PubMed]
- Gami AS, Olson EJ, Shen WK, Wright RS, Ballman KV, Hodge DO, Herges RM, Howard DE, Somers VK. Obstructive sleep apnea and the risk of sudden cardiac death: a longitudinal study of 10,701 adults. J Am Coll Cardiol. 2013 Aug 13;62(7):610-6. [CrossRef] [PubMed]
- Butler MP, Emch JT, Rueschman M, Sands SA, Shea SA, Wellman A, Redline S. Apnea-Hypopnea Event Duration Predicts Mortality in Men and Women in the Sleep Heart Health Study. Am J Respir Crit Care Med. 2019 Apr 1;199(7):903-912. [CrossRef] [PubMed]
- Azarbarzin A, Sands SA, Stone KL, et al. The hypoxic burden of sleep apnoea predicts cardiovascular disease-related mortality: the Osteoporotic Fractures in Men Study and the Sleep Heart Health Study. Eur Heart J. 2019 Apr 7;40(14):1149-1157. [CrossRef] [PubMed]
- Budhiraja R, Javaheri S, Parthasarathy S, Berry RB, Quan SF. The Association Between Obstructive Sleep Apnea Characterized by a Minimum 3 Percent Oxygen Desaturation or Arousal Hypopnea Definition and Hypertension. J Clin Sleep Med. 2019 Sep 15;15(9):1261-1270. [CrossRef] [PubMed]
- Budhiraja R, Javaheri S, Parthasarathy S, Berry RB, Quan SF. Incidence of hypertension in obstructive sleep apnea using hypopneas defined by 3 percent oxygen desaturation or arousal but not by only 4 percent oxygen desaturation. J Clin Sleep Med. 2020 Oct 15;16(10):1753-1760. [CrossRef] [PubMed]
- Quan SF, Budhiraja R, Javaheri S, Parthasarathy S, Berry RB. The association between obstructive sleep apnea defined by 3 percent oxygen desaturation or arousal definition and self-reported cardiovascular disease in the Sleep Heart Health Study. Southwest J Pulm Crit Care. 2020;21(4):86-103. [CrossRef]
Abbreviations
- AASM American Academy of Sleep Medicine
- AHI Apnea hypopnea index
- AHI3%A Apnea hypopnea index defined using a hypopnea definition requiring a minimum 3% O2 desaturation or arousal
- AHI4% Apnea hypopnea index defined using a hypopnea definition requiring a minimum 4% O2 desaturation
- BMI Body mass index
- CMS Centers for Medicare and Medicaid Services
- CVD Cardiovascular disease
- HDL High density lipoprotein
- HR Hazard ratio
- OSA Obstructive sleep apnea
- SHHS Sleep Heart Health Study
Acknowledgements
The Sleep Heart Health Study was supported by National Heart, Lung and Blood Institute cooperative agreements U01HL53940 (University of Washington), U01HL53941 (Boston University), U01HL53938 (University of Arizona), U01HL53916 (University of California, Davis), U01HL53934 (University of Minnesota), U01HL53931 (New York University), U01HL53937 and U01HL64360 (Johns Hopkins University), U01HL63463 (Case Western Reserve University), and U01HL63429 (Missouri Breaks Research). A list of SHHS investigators, staff and their participating institutions is available on the SHHS website, http://jhuccs1.us/shhs/details/investigators.htm.
Cite as: Budhiraja R, Quan SF. Long-term all-cause mortality risk in obstructive sleep apnea using hypopneas defined by a ≥3 percent oxygen desaturation or arousal. Southwest J Pulm Crit Care. 2021;23(1):23-35. doi: https://doi.org/10.13175/swjpcc025-21 PDF
The Association Between Obstructive Sleep Apnea Defined by 3 Percent Oxygen Desaturation or Arousal Definition and Self-Reported Cardiovascular Disease in the Sleep Heart Health Study
Stuart F. Quan, M.D.1,2
Rohit Budhiraja, M.D.1
Sogol Javaheri, M.A., M.D., M.P.H.1
Sairam Parthasarathy, M.D.2
Richard B. Berry, M.D.3
1Division of Sleep and Circadian Disorders, Brigham and Women’s Hospital, Harvard Medical School, Boston, MA; 2Department of Medicine, University of Arizona College of Medicine, Tucson, AZ; 3Division of Pulmonary, Critical Care, and Sleep Medicine, University of Florida, Gainesville, FL
Editor's Note: Click here to see an accompanying editorial.
Abstract
Background: Studies have established that OSA defined using a hypopnea definition requiring a >4% oxygen desaturation (AHI4%) is associated with cardiovascular (CVD) or coronary heart (CHD) disease. This study determined whether OSA defined using a hypopnea definition characterized by a >3% oxygen desaturation or an arousal (AHI3%A) is associated with CVD/CHD.
Methods: Data were analyzed from 6307 Sleep Heart Health Study participants who had polysomnography. Self-reported CVD included angina, heart attack, heart failure, stroke or previous coronary bypass surgery or angioplasty. Self-reported CHD included the aforementioned conditions but not stroke or heart failure. The association between OSA and CVD/CHD was examined using logistic regression models with stepwise inclusion of demographic, anthropometric, social/behavioral and co-morbid medical conditions. A parsimonious model in which diabetes and hypertension were excluded because of their potential to be on the causal pathway between OSA and CVD/CHD also was constructed.
Results: For CVD, the odds ratios and 95% confidence intervals for AHI3%A >30/hour were 1.39 (1.03-1.87) and 1.45 (1.09-1.94) in the fully adjusted and parsimonious models. Results for CHD were 1.29 (0.96-1.74) and 1.36 (0.99-1.85). In participants without OSA according to more stringent AHI4% criteria but with OSA using the AHI3%A definition, similar findings were observed.
Conclusion: OSA defined using an AHI3%A is associated with both CVD and CHD. Use of a more restrictive AHI4% definition will misidentify a large number of individuals with OSA who have CVD or CHD. These individuals may be denied access to therapy, potentially worsening their underlying CVD or CHD.
Introduction
Obstructive sleep apnea (OSA) is a common disorder characterized by recurrent episodes of either complete upper airway collapse (apneas) or partial collapse (hypopneas) during sleep. A number of large studies have established that OSA is a risk factor for the development of hypertension and cardiovascular disease (CVD) as well as higher mortality; individuals with more severe OSA are at greater risk (1-3). The most commonly used metric of OSA severity is the apnea hypopnea index (AHI). However, there is controversy regarding the definition of the AHI. In 2012, the American Academy of Sleep Medicine (AASM) recommended that the hypopnea definition include any decrease in airflow by at least 30% from the baseline with an oxyhemoglobin desaturation of at least 3%, or an arousal from sleep (4). However, several payors including the Centers for Medicare and Medicaid Services (CMS) continue to require a more stringent hypopnea definition necessitating a 4% or greater decrease in oxygen saturation (5) despite evidence documenting a relationship between the AASM recommended standard and daytime sleepiness (6). The resistance to universal acceptance of the AASM criteria is based in part on the lack of evidence that 3% desaturations or arousals have an adverse cardiovascular impact. This reluctance to adopt a more inclusive definition of sleep apnea has restricted access to OSA treatment for many patients (7). Therefore, determining if there is relationship between OSA characterized by at least 3% drop in saturation or an arousal from sleep and CVD may assist in identification of persons at risk for CVD, allow greater access to care and potentially improve other health-related outcomes.
Using the database from the Sleep Heart Health Study, a large well-characterized community based cohort that had undergone polysomnography, the current study aimed to determine the association between the AASM recommended definition of the AHI which incorporates hypopneas with at least a 3% desaturation or an arousal (AHI3%A) and self-reported CVD and coronary heart disease (CHD) in middle-aged and older adults. In addition, we sought to ascertain whether there was an association between CVD or CHD and OSA severity among individuals who were not identified as having OSA using the more restrictive standard of requiring at least a 4% oxygen desaturation irrespective of an arousal (AHI4%), but were classified as having OSA by the AHI3%A definition. We hypothesized that increasing OSA severity represented by the AHI3%A would be associated with a greater likelihood of having prevalent CVD or CHD, and that persons who were not identified as having OSA using the AHI4% criteria would have a higher likelihood as well.
Methods
This study analyzed data obtained from the Sleep Heart Health Study (SHHS) which was a prospective multicenter cohort study designed to investigate the relationship between OSA and cardiovascular diseases in the United States. The study’s rationale and design have been published elsewhere (8). Briefly, 6,441 subjects, 40 years of age and older were recruited starting in 1995 from several ongoing “parent” cardiovascular and respiratory disease cohorts that were initially assembled between 1976 and 1995 (9). These cohorts included the Offspring Cohort and the Omni Cohort of the Framingham Heart Study in Massachusetts; the Hagerstown, MD, and Minneapolis, MN, sites of the Atherosclerosis Risk in Communities Study; the Hagerstown, MD, Pittsburgh, PA, and Sacramento, CA, sites of the Cardiovascular Health Study; 3 hypertension cohorts (Clinic, Worksite, and Menopause) in New York City; the Tucson Epidemiologic Study of Airways Obstructive Diseases and the Health and Environment Study; and the Strong Heart Study of American Indians in Oklahoma, Arizona, North Dakota, and South Dakota. Because of sovereignty issues, 134 participants from the Arizona cohort of the Strong Heart Study withdrew consent. Analyses were performed on the remaining 6307 participants. The SHHS was approved by each site’s institutional review board for human subjects’ research, and informed written consent was obtained from all subjects at the time of their enrollment.
Polysomnography and Home Visit
Participants underwent overnight in-home polysomnograms using the Compumedics Portable PS-2 System (Abbottsville, Victoria, Australia) administered by trained technicians (10). The home visits were performed by two-person, mixed-sex teams in visits that lasted 1.5 to 2 hours. Participants were asked to schedule the visit so that it would occur approximately two hours prior to their usual bedtime. At the time of the home visit, an inventory of each participant’s medications was made. In addition, a health interview was completed that ascertained the presence of several health conditions. Questionnaires that were completed included the SHHS Sleep Habits Questionnaire which incorporated the Epworth Sleepiness Scale (ESS) (11) and the Medical Outcomes Study SF-36 (12). Blood pressure was measured manually in triplicate in a seated position after 5 minutes of rest (13). The average of the second and third measurements was used for this analysis. Body weight was obtained using a digital scale.
The SHHS recording montage consisted of electroencephalogram (C4/A1 and C3/A2), right and left electrooculogram, a bipolar submental electromyogram, thoracic and abdominal excursions (inductive plethysmography bands), airflow (detected by a nasal-oral thermocouple (Protec, Woodinville, WA), oximetry (finger pulse oximetry [Nonin, Minneapolis, MN]), electrocardiogram and heart rate (using a bipolar electrocardiogram lead), body position (using a mercury gauge sensor), and ambient light (on/off, by a light sensor secured to the recording garment). Sensors were placed, and equipment was calibrated during an evening home visit by a certified technician. After technicians retrieved the equipment, the data, stored in real time on PCMCIA cards, were downloaded to the computers of each respective clinical site, locally reviewed, and forwarded to a central reading center (Case Western Reserve University, Cleveland, OH). Comprehensive descriptions of polysomnography scoring and quality-assurance procedures have been previously published (14). In brief, sleep was scored according to guidelines developed by Rechtschaffen and Kales (15). Strict protocols were maintained to ensure comparability among centers and technicians. Intra-scorer and inter-scorer reliabilities were high (14).
The apnea hypopnea index (AHI) was calculated for each participant using two definitions of hypopnea, the AASM recommended definition [AHI3%A] and the AASM acceptable [CMS] definition [AHI4%]. For AHI3%A, hypopneas were identified if the amplitude of a measure of flow or volume (detected by the thermocouple or thorax or abdominal inductance band signals) was reduced discernibly (at least 30% lower than baseline breathing) for at least 10 seconds, did not meet the criteria for apnea and the event was associated with either a 3% oxygen desaturation from baseline or terminated with electroencephalographic evidence of an arousal. For AHI4%, hypopneas were identified if the aforementioned reduction in flow or volume occurred and the event was associated with a 4% oxygen desaturation from baseline. In both cases, an apnea was defined as a complete or almost complete cessation of airflow, as measured by the amplitude of the thermocouple signal, lasting at least 10 seconds.
Outcome Assessment
Self-reported CVD and CHD were the outcomes of interest for this analysis and were obtained from the standardized health interview performed at the time of each participant’s polysomnography home visit. Participants were asked if they had ever been told by a doctor that she or he had angina, heart attack, heart failure, or stroke and if the participant had ever undergone coronary bypass surgery or coronary angioplasty. Prevalent CVD was defined as a positive response to one or more of the aforementioned conditions or procedures. Prevalent CHD was defined as an affirmative response to the same questions with the exclusion of responses to the presence of heart failure or stroke.
Covariates
Selection of potential covariates was based on previous studies documenting an association with either CVD or CHD. These included various demographic (e.g., sex, race/ethnicity, education, marital status), anthropometric (e.g., height, weight and blood pressure [BP]), social/behavioral (e.g., smoking history, alcohol use, sleep duration, quality of life) indices as well as plasma lipids (cholesterol, high density lipoprotein [HDL], triglycerides), several diseases (depression, hypertension, diabetes) and spirometry.
The following definitions were used for those covariates that were not primarily recorded. Body mass index (BMI) was calculated as weight (kg)/height (m2). The ankle arm index (AAI) was computed as the ratio of blood pressure at the ankle to that in the arm. Waist to hip ratio was the waist divided by hip circumferences. Hypertension was defined as a self-report of hypertension or the use of anti-hypertensive medications. Diabetes was considered present if it was self-reported by the participant or if there was use of oral hypoglycemic agents or insulin. Depression was defined as present if the participant indicated on the SF-36 that he/she was feeling “blue” or “down” for at least “a good bit of the time” for the previous 4 weeks, or he/she was using antidepressant medications. Insomnia was defined as often or almost always having “trouble falling asleep”, “waking up during the middle of the night and having difficulty getting back to sleep” or “waking up too early in the morning and being unable to get back to sleep”. Sleepiness was assessed by the ESS as well as by self-report of being excessively sleepy during the day most or almost all of the time.
Statistical Analyses
Mean and standard deviation, and percentages were used to provide an overall description of the data used in the analyses. Unadjusted differences were compared using Student’s t test or c2. For both definitions of the AHI, each participant’s AHI was assigned to one of 4 OSA severity categories: Normal (AHI <5 /hour), Mild (AHI ≥5 and <15 /hour), Moderate (AHI ≥15 and < 30/hour) and Severe (AHI ≥30/hour).
Missing data was present in 4.8% of observations and were felt to be missing at random. Inasmuch as using a “complete case analysis” would result in exclusion of a significant number of participants from our analyses with a consequent reduction in statistical power, multiple imputation using the multiple imputation by chained equation (MICE) package in R was employed to generate replacement values. Comparison of the imputed to the original dataset did not identify any outliers in the imputed dataset and means of the same variables between datasets were comparable.
To reduce the number of relevant predictors, overfitting of models, reduce potential collinearity and minimize prediction error, a Least Absolute Shrinkage and Selection Operator (lasso) regression was performed for both outcome variables using the glmnet package in R. This resulted in an analytic dataset for CVD that consisted of the following: age, sex, race/ethnicity, BMI, AAI, diastolic BP, smoking, SF-36 physical component summary (PCS), SF-36 general health rating (GenHlth), SF-36 ability to perform vigorous activity (VigActiv), hypertension, diabetes, depression and HDL. For CHD, the analytic dataset consisted of the following: age, sex, race/ethnicity, BMI, diastolic BP, smoking, PCS, GenHlth, VigActiv, hypertension, diabetes, triglycerides and HDL.
For the entire cohort, logistic regression using SPSS v27 (Armonk, NY) was used to generate increasingly complex models of the relationship between either CVD or CHD and severity of OSA adjusting for the covariates identified using the lasso regression. For CVD, after the unadjusted model, models were generated for the sequential addition of demographic factors (age, sex, race/ethnicity), anthropometric factors (BMI, AAI, diastolic BP), social/behavioral characteristics (smoking, PCS, GenHlth, VigActiv) and diseases/conditions (hypertension, diabetes, depression, HDL). For CHD after the unadjusted model, the corresponding sequential models were demographic factors (age, sex, race/ethnicity), anthropometric factors (BMI, diastolic BP), social/behavioral characteristics (smoking, PCS, GenHlth, VigActiv) and diseases/conditions (hypertension, diabetes, triglycerides, HDL). Because of the possibility that adjustment for a hypertension and a diabetes indicator would be “overadjustment” (i.e., adjustment for a variable on a causal pathway), we excluded both hypertension and diabetes from the final set of covariates in additional analyses and these are referred to as “parsimonious models.” Lastly, sensitivity analyses were performed in which the natural log of AHI3%A was used instead of categorial levels of that factor in the above models.
Associations between both CVD and CHD, and OSA severity were further analyzed in the subgroup of participants who were not classified as having OSA based on AHI4% criteria but were classified as OSA using AHI3%A criteria. The moderate and severe categories were combined because of the small number of cases in the severe OSA category. Otherwise, the modelling approaches employed were identical.
In Tables 2-5, odds ratios and 95% CI are presented versus the reference level of AHI <5 /hour. P values refer to the overall significance of the model with respect to OSA severity. Odds ratios, 95% CI and P values in Table 6 refer to AHI3%A expressed as the continuous factor lnAHI3%A+0.1 (0.1 added to mitigate 0 values of lnAHI3%A).
Results
Table 1 shows the univariate association of potential risk factors or characteristics with the presence of CVD or CHD.
Table 1. Univariate Association of Various Characteristics to Prevalent Cardiovascular (CVD) and Coronary Heart Disease (CHD)

N=6307 for all characteristics except AHI 3%/A (N=6131)
ap≤0.05; bp≤0.01; cp≤0.001
There were 962 cases (15%) of CVD and 797 (13%) cases of CHD identified. Except for total cholesterol, all were either more prevalent or significantly higher or lower in participants with CVD or CHD. For both CVD and CHD, markedly higher prevalence rates were noted for sex (higher in men), hypertension, diabetes, depression, smoking (higher in ever smokers) and ability to engage in vigorous activity. Conversely, white race and good health status were much less common among those with CVD or CHD. Differences observed for the remaining characteristics were of lesser magnitude.
Figure 1 shows the prevalence rates of CVD or CHD as a function of OSA severity using the AHI3%A criteria. Both conditions were associated with increasing higher rates of disease as OSA became more severe.

Figure 1. Percentage of participants with either cardiovascular (CVD) or coronary heart (CHD) disease according to increasing severity of obstructive sleep apnea defined using a hypopnea definition characterized by a minimum 3% oxygen desaturation or an arousal (AHI3%A)
Table 2 shows the crude and adjusted odds ratios and their 95% confidence intervals for increasing complex models of the relationship between CVD and AHI3%A. The unadjusted model showed a strong, progressive association with increasingly severe OSA. However, as the models became increasingly complex, this relationship was attenuated and only approached statistical significance in the fully adjusted model (+Medical Conditions). Removal of hypertension and diabetes to create the Parsimonious model restored some of the association with a return of statistical significance.
Table 2. Adjusted Relative Odds (95% Confidence Interval) of Self-Reported Prevalent Cardiovascular Disease According to 3% or Arousal Apnea Hypopnea Index Severity Categories

aDemographics model adds age, sex, race (White vs. American Indian)
bAnthropometrics model adds BMI, Ankle Arm Index, diastolic blood pressure
cSocial/Behavioral Factors model adds smoking, SF36 Physical Component Summary, SF36 General Health, SF36 Vigorous Activity
dMedical Conditions model adds hypertension, diabetes, depression and HDL
eParsimonious model includes factors in previous models, but removes hypertension and diabetes
fN=6307
Presented in Table 3 are the models demonstrating the relationship between CHD and AHI3%A.
Table 3. Adjusted Relative Odds (95% Confidence Interval) of Self-Reported Prevalent Coronary Heart Disease According to 3% or Arousal Apnea Hypopnea Index Severity Categoriesf

aDemographics model adds age, sex, race (White vs. American Indian)
bAnthropometrics model adds BMI, diastolic blood pressure
cSocial/Behavioral Factors model adds smoking, SF36 Physical Component Summary, SF36 General Health, SF36 Vigorous Activity
dMedical Conditions model adds hypertension, diabetes, triglycerides and HDL
eParsimonious model includes factors in previous models, but removes hypertension and diabetes
fN=6307
Similar to the findings for CVD, there was a progressively higher odds of having CHD as severity of OSA increased. The fully adjusted model (+Medical Conditions) was not significant, but the Parsimonious model approached statistical significance.
There were 3,326 participants who did not have OSA as defined by AHI4% criteria. Within this cohort, 2247 were classified as OSA using the AHI3%A criteria; 1966 (87.4%) were mild, 271 (12.0%) were moderate and 10 (0.4%) were severe. For this subgroup, Table 4 presents the increasingly complex models illustrating the relationship between the presence of CVD and increasing OSA severity.
Table 4. Adjusted Relative Odds (95% Confidence Interval) of Self-Reported Prevalent Cardiovascular Disease According to 3% or Arousal Apnea Hypopnea Index Severity Categories in Participants Without Obstructive Sleep Apnea According to 4% Desaturation Criteriaf

aDemographics model adds age, sex, race (White vs. American Indian)
bAnthropometrics model adds BMI, Ankle Arm Index, diastolic blood pressure
cSocial/Behavioral Factors model adds smoking, SF36 Physical Component Summary, SF36 General Health, SF36 Vigorous Activity
dMedical Conditions model adds hypertension, diabetes, depression and HDL
eParsimonious model includes factors in previous models, but removes hypertension and diabetes
fN=3326
Because of the relatively small number of cases with severe OSA, the moderate and severe cases were combined for these analyses. The unadjusted model showed a strong relationship with OSA severity; as model complexity increased, this finding was attenuated and only approached statistical significance in both the fully adjusted (+Medical Conditions) and Parsimonious models. As demonstrated in Table 5, similar findings were observed for CHD; the unadjusted model showed a strong association which was attenuated as the models became more complex; the fully adjusted (+medical conditions) and parsimonious models approached statistical significance.
Table 5. Adjusted Relative Odds (95% Confidence Interval) of Self-Reported Prevalent Coronary Heart Disease According to 3% or Arousal Apnea Hypopnea Index Severity Categories in Participants Without Obstructive Sleep Apnea According to 4% Desaturation Criterionf

aDemographics model adds age, sex, race (White vs. American Indian)
bAnthropometrics model adds BMI, diastolic blood pressure
cSocial/Behavioral Factors model adds smoking, SF36 Physical Component Summary, SF36 General Health, SF36 Vigorous Activity
dMedical Conditions model adds hypertension, diabetes, triglycerides and HDL
eParsimonious model includes factors in previous models, but removes hypertension and diabetes
fN=3326
In sensitivity analyses, the natural log of AHI3%A was used as the index of OSA severity in lieu of a categorial representation. As shown in Table 6, in the entire cohort, for both CVD and CHD, a significant linear relationship with increasing severity of OSA was demonstrated in parsimonious models, but not the fully adjusted models. In the subgroup who did not have OSA as defined by AHI4% criteria but did have OSA using the AHI3%A criteria, linear relationships noted for both CVD and CHD in the fully adjusted and parsimonious models. For CHD in the fully adjusted model, the relationship was statistically significant and approached statistical significance in the others.
Table 6. Linear Adjusted Relative Odds (95% Confidence Interval) of Self-Reported Prevalent Cardiovascular and Coronary Heart Disease According to 3% or Arousal Apnea Hypopnea Index Severity

aCohort restricted participants without OSA according to AHI4% criteria, N=3326
bCovariates for CVD: age, sex, race, BMI, ankle-arm index, diastolic blood pressure
smoking, SF36 Physical Component Summary, SF36 General Health, SF36 Vigorous Activity
hypertension, diabetes, depression and HDL; Covariates for CHD: age, sex, race, BMI, diastolic blood pressure,smoking, SF36 Physical Component Summary, SF36 General Health, SF36 Vigorous Activity, hypertension, diabetes, triglycerides and HDL
cExcludes diabetes and hypertension from fully adjusted model
Discussion
In this large community-based study, we demonstrated that OSA defined by apneas and hypopneas characterized by 3% desaturation events or arousals is associated with an increased likelihood of self-reported CVD and CHD after controlling for a number of relevant covariates. Importantly, in a subset of this cohort who did not have OSA as defined by apneas and hypopneas requiring a minimum 4% oxygen desaturation but did have OSA using the 3% desaturation or arousal criteria, we found that the association with both CVD and CHD remained, albeit weaker. Nevertheless, our analyses overall suggest that the regulatory requirement by the Centers for Medicare and Medicaid Services (CMS) in the United States of using a 4% desaturation definition to identify patients with OSA denies a substantial proportion of these individuals the opportunity to be treated for their OSA and thus reduce the risk of worsening or recurrence of their CVD or CHD.
Results from several large cohort studies including SHHS have found that OSA is associated with the presence of CVD and CHD, and that this association is stronger when the AHI as a metric of OSA severity increases (1, 2). These previous studies have used a definition of hypopnea that requires a minimum 4% oxygen desaturation (16-18). This definition has been adopted by CMS and other insurers to identify individuals as having OSA (5). However, the AASM recommends defining hypopneas with a minimum 3% desaturation or an arousal (4). This is based on evidence indicating that daytime sleepiness and other symptoms of OSA are associated with this less stringent definition of OSA (6). This distinction has important clinical implications because there are a large number of patients who do not meet the AHI4% criteria and but do meet the AHI3%A criteria (7, 19). In the former case, they are not considered to have OSA, but do have it in the latter.
To our knowledge, our study is the first to assess the association between OSA using the AHI3%A criteria and CVD and CHD. We found that as OSA severity increased, there was a greater likelihood of having CVD and CHD after adjusting for a number of relevant covariates. We acknowledge that in the fully adjusted model, this association only approached statistical significance. However, in our parsimonious model which removed the presence of hypertension and diabetes, likely mediators of this relationship, the association was strengthened. Sensitivity analyses using the natural log of AHI3%A validated the results we observed with categories of AHI severity. It has been well-established that hypertension and diabetes are independent risk factors for the development of CVD and CHD. However, a number of studies have demonstrated that OSA is a risk factor for the development of both hypertension and diabetes (1, 20). Therefore, both of the latter conditions lie on the causal path by which OSA may increase the risk for the development of CVD and CHD. Hence, we believe that inclusion of both these conditions in our fully adjusted model may be over-adjustment and that our parsimonious model best represents the association between OSA defined by AHI3%A and CVD or CHD.
We identified there was a large subset of our cohort that had OSA using the AHI3%A definition, but not the AHI4% definition of hypopnea. In this subset, we also observed an association between OSA severity and both CVD and CHD. This finding is analogous to the relationship we recently observed between OSA and the prevalence of hypertension (19). Similar to our findings with the full cohort, the fully adjusted model for both CVD and CHD was not statistically significant. However, it approached or became statistically significant in the parsimonious models. Although most of these cases were in the mild OSA category, 12.4% were moderate to severe where treatment is almost always recommended. Individuals with prevalent CVD or CHD and OSA are at risk for further complications of their CVD or CHD (21-23). However, if they do not meet the AHI4% definition of OSA, access to OSA treatment would be denied by CMS and some insurers.
Our findings with respect to CVD and CHD are consistent with recent analyses demonstrating that OSA defined by AHI3%A is associated with prevalent and incident hypertension in the SHHS cohort (19, 24). Similar findings also have been observed in other cohorts providing additional evidence that use of a hypopnea definition incorporating a minimum 3% oxygen desaturation or an arousal is important in the identification of individuals with OSA (25-27).
Although there is substantial evidence emerging that intermittent hypoxemia plays an important role in the cardiovascular consequences of OSA (28), the importance of arousals remains uncertain (29). Arousals involve an increase in the sympathetic activity and a decrease in the parasympathetic activity (28) and there is some evidence linking them in the development of hypertension (30). Data from our study would suggest that they may contribute to the development of CVD or CHD as well.
Some (31, 32), but not all (33) studies have suggested that the impact of OSA on the development of CVD or CHD is in part enhanced by the presence of sleepiness. However, in our initial assessment of potential covariates using a lasso regression, sleepiness did not emerge as a significant factor. Thus, our findings do not support the contention that sleepiness is an important factor impacting the relationship between OSA and CVD or CHD.
Our study does have a few limitations. Most important is that we identified prevalent CVD and CHD by self-report. While it is possible that some misclassification occurred, we do not think it was large. A large number of potential covariates were considered for inclusion in the models; we used a lasso regression to reduce the possibility of over-adjustment and collinearity. Furthermore, the possibility of residual confounding remains. Finally, this is a cross-sectional analysis, and causality cannot be assumed.
This study has several strengths. It uses a large, well characterized cohort with the availability of data from a number of potential covariates. Additionally, the cohort had a diverse racial/ethnic, age and sex distribution. Polysomnography was used to document the presence of OSA, and not more limited sleep apnea testing.
In summary, OSA as defined by apneas and hypopneas requiring a minimum 3% oxygen desaturation or arousal is associated with an increased likelihood of having CVD or CHD. Use of a more restrictive definition requiring a minimum 4% desaturation will misidentify a large number of individuals with OSA, and CVD or CHD. These individuals may be denied access to therapy which may prevent worsening of their underlying CVD or CHD.
Acknowledgements
SHHS acknowledges the Atherosclerosis Risk in Communities Study, the Cardiovascular Health Study, the Framingham Heart Study, the Cornell/Mt. Sinai Worksite and Hypertension Studies, the Strong Heart Study, the Tucson Epidemiologic Study of Airways Obstructive Diseases (TESAOD), and the Tucson Health and Environment Study for allowing their cohort members to be part of the SHHS and for sharing such data for the purposes of this study. SHHS is particularly grateful to the members of these cohorts who agreed to participate in SHHS as well. SHHS further recognizes all the investigators and staff who have contributed to its success. A list of SHHS investigators, staff, and their participating institutions is available on the SHHS website (www.jhsph.edu/shhs).
The opinions expressed in this paper are those of the authors and do not necessarily reflect the views of the Indian Health Service.
This work was supported by National Heart, Lung and Blood Institute cooperative agreements U01HL53940 (University of Washington), U01HL53941 (Boston University), U01HL53938 (University of Arizona), U01HL53916 (University of California, Davis), U01HL53934 (University of Minnesota), U01HL53931 (New York University), U01HL53937 and U01HL64360 (Johns Hopkins University), U01HL63463 (Case Western Reserve University), U01HL63429 (Missouri Breaks Research).
SP was supported by Patient Centered Outcomes Research Institute (CER-2018C2-13262; PCS-1504-30430; DI-2018C2-13161; DI-2018C2-13161 COVID supplement, EADI-16493), NIH (HL126140, HL151254, AI135108, AG059202, HL158253) and American Academy of Sleep Medicine Foundation during the writing of this manuscript.
Authors’ Declarations: Dr. Budhiraja reports no conflicts of interest or grant funding. Dr. Quan reports research funding from the National Institutes of Health, serves as a consultant to Jazz Pharmaceuticals, Whispersom and is a committee chair and hypopnea taskforce member for the American Academy of Sleep Medicine. Dr. Javaheri serves as a consultant for Jazz Pharmaceuticals and Harmony Biosciences. Dr. Berry reports research funding from Philips Respironics, Res Med and the University of Florida Foundation. Dr. Parthasarathy reports grants from NIH/NHLBI as PI (HL138377, HL126140; IPA-014264-00001; HL095799) or site PI (HL128954; UG3HL140144), grants from Patient Centered Outcomes Research Institute as PI (IHS-1306-02505; EAIN-3394-UOA) or site-investigator (PCS-1504-30430), grants from US Department of Defense as co-investigator (W81XWH-14-1-0570), grants from NIH/NCI as co-investigator (R21CA184920) and NIH/NIMHD as co-investigator (MD011600), grants from Johrei Institute, personal fees from American Academy of Sleep Medicine, non-financial support from National Center for Sleep Disorders Research of the NIH (NHLBI), personal fees from UpToDate Inc., grants from Younes Sleep Technologies, Ltd., personal fees from Vapotherm, Inc., personal fees from Merck, Inc., grants from Philips-Respironics, Inc., personal fees from Philips-Respironics, Inc., personal fees from Bayer, Inc., personal fees from Nightbalance, Inc, personal fees from Merck, Inc, grants from American Academy of Sleep Medicine Foundation (169-SR-17); In addition, Dr. Parthasarathy has a patent UA 14-018 U.S.S.N. 61/884,654; PTAS 502570970 (Home breathing device) issued.
A preprint of this paper is available at: medRxiv, https://doi.org/10.1101/2020.09.22.20199745
Abbreviation List
AHI Apnea Hypopnea Index
AHI3%A Hypopneas with at least a 3% oxygen desaturation or an arousal
AHI4% Hypopneas with at least a 4% oxygen desaturation
AAI Ankle arm index
BP Blood pressure
BMI Body mass index
CHD Coronary heart disease
CVD Cardiovascular disease
CMS Centers for Medicare and Medicaid Services
ESS Epworth sleepiness scale
GenHlth General health rating subscale of SF36
Glmnet A statistical package used in R that fits a generalized linear model via penalized maximum likelihood
HDL High density lipoprotein
Lasso Least Absolute Shrinkage and Selection Operator
MICE Multiple imputation by chained equation
OSA Obstructive sleep apnea
PCS Physical component summary of the SF36
R An open source programming language used for statistical computing and graphics
SHHS Sleep Heart Health Study
VigActiv Vigorous activity rating subscale of the SF36
References
- Hou H, Zhao Y, Yu W, Dong H, Xue X, Ding J, Xing W, Wang W. Association of obstructive sleep apnea with hypertension: A systematic review and meta-analysis. J Glob Health. 2018 Jun;8(1):010405. [CrossRef] [PubMed]
- Mashaqi S, Gozal D. The impact of obstructive sleep apnea and PAP therapy on all-cause and cardiovascular mortality based on age and gender - a literature review. Respir Investig. 2020 Jan;58(1):7-20. [CrossRef] [PubMed]
- Berry RB, Budhiraja R, Gottlieb DJ, et al. Rules for scoring respiratory events in sleep: update of the 2007 AASM Manual for the Scoring of Sleep and Associated Events. Deliberations of the Sleep Apnea Definitions Task Force of the American Academy of Sleep Medicine. J Clin Sleep Med. 2012;8(5):597-619. [CrossRef] [PubMed]
- Anonymous. CPAP for Obstructive Sleep Apnea. Last Updated: 2020. Accessed: 09/14, 2020. https://www.cms.gov/Medicare/Coverage/Coverage-with-Evidence-Development/CPAP.
- Shamin-Uzzaman QA, Singh S, Chowdhuri S. Hypopnea definitions, determinants, and dilemmas: a focused review. Sci Sleep Pract. 2018;2(1):7. [CrossRef]
- Raj R, Hirshkowitz M. Effect of the new Medicare guideline on patient qualification for positive airway pressure therapy. Sleep Med. 2003 Jan;4(1):29-33.
- [CrossRef] [PubMed]
- Quan SF, Howard BV, Iber C, Kiley JP, Nieto FJ, O'Connor GT, Rapoport DM, Redline S, Robbins J, Samet JM, Wahl PW. The Sleep Heart Health Study: design, rationale, and methods. Sleep. 1997 Dec;20(12):1077-85. [PubMed]
- Lind BK, Goodwin JL, Hill JG, Ali T, Redline S, Quan SF. Recruitment of healthy adults into a study of overnight sleep monitoring in the home: experience of the Sleep Heart Health Study. Sleep Breath. 2003;7(1):13-24. [CrossRef] [PubMed]
- Iber C, Redline S, Kaplan Gilpin AM, et al. Polysomnography performed in the unattended home versus the attended laboratory setting--Sleep Heart Health Study methodology. Sleep. 2004;27(3):536-540. HTTPS://PUBMED.NCBI.NLM.NIH.GOV/ 15164911 [CrossRef] [PubMed]
- Johns MW. A new method for measuring daytime sleepiness: the Epworth sleepiness scale. Sleep. 1991;14(6):540-545. [CrossRef] [PubMed]
- Ware JE,Jr, Sherbourne CD. The MOS 36-item short-form health survey (SF-36). I. Conceptual framework and item selection. Med Care. 1992;30(6):473-483. [CrossRef] [PubMed]
- O'Connor GT, Caffo B, Newman AB, et al. Prospective study of sleep-disordered breathing and hypertension: the Sleep Heart Health Study. Am J Respir Crit Care Med. 2009;179(12):1159-1164. [CrossRef] [PubMed]
- Whitney CW, Gottlieb DJ, Redline S, et al. Reliability of scoring respiratory disturbance indices and sleep staging. Sleep. 1998;21(7):749-757. [CrossRef] [PubMed]
- Rechtschaffen A, Kales A. A Manual of Standardized Terminology, Techniques and Scoring System for Sleep Stages of Human Subject. Washington, D.C.: US Government Printing Office, National Institute of Health Publication, 1968.
- Marin JM, Carrizo SJ, Vicente E, Agusti AG. Long-term cardiovascular outcomes in men with obstructive sleep apnoea-hypopnoea with or without treatment with continuous positive airway pressure: an observational study. Lancet. 2005 Mar 19-25;365(9464):1046-53. [CrossRef] [PubMed]
- Shahar E, Whitney CW, Redline S, et al. Sleep-disordered breathing and cardiovascular disease: cross-sectional results of the Sleep Heart Health Study. Am J Respir Crit Care Med. 2001;163(1):19-25. [CrossRef] [PubMed]
- Young T, Finn L, Peppard PE, Szklo-Coxe M, Austin D, Nieto FJ, Stubbs R, Hla KM. Sleep disordered breathing and mortality: eighteen-year follow-up of the Wisconsin sleep cohort. Sleep. 2008 Aug;31(8):1071-8. [PubMed]
- Budhiraja R, Javaheri S, Parthasarathy S, Berry RB, Quan SF. The Association Between Obstructive Sleep Apnea Characterized by a Minimum 3 Percent Oxygen Desaturation or Arousal Hypopnea Definition and Hypertension. J Clin Sleep Med. 2019 Sep 15;15(9):1261-1270 [CrossRef] [PubMed]
- Qie R, Zhang D, Liu L, Ren Y, Zhao Y, Liu D, Liu F, Chen X, Cheng C, Guo C, Li Q, Zhou Q, Tian G, Han M, Huang S, Wu X, Qin P, Li J, Cao J, Zhang M, Huang J, Lu J, Li H, Wang J, Cheng R, Hu D. Obstructive sleep apnea and risk of type 2 diabetes mellitus: A systematic review and dose-response meta-analysis of cohort studies. J Diabetes. 2020 Jun;12(6):455-464. doi: 10.1111/1753-0407.13017. Epub 2020 Jan 22. [CrossRef] [PubMed]
- Yudi MB, Clark DJ, Farouque O, Andrianopoulos N, Ajani AE, Brennan A, Lefkovits J, Freeman M, Hiew C, Selkrig LA, O'Brien J, Dart AM, Reid CM, Duffy SJ; Melbourne Interventional Group. Trends and predictors of recurrent acute coronary syndrome hospitalizations and unplanned revascularization after index acute myocardial infarction treated with percutaneous coronary intervention. Am Heart J. 2019 Jun;212:134-143. [CrossRef] [PubMed]
- Lee CH, Khoo SM, Chan MY, Wong HB, Low AF, Phua QH, Richards AM, Tan HC, Yeo TC. Severe obstructive sleep apnea and outcomes following myocardial infarction. J Clin Sleep Med. 2011 Dec 15;7(6):616-21. [CrossRef] [PubMed]
- Maia FC, Goulart AC, Drager LF, Staniak HL, Santos IS, Lotufo PA, Bensenor IM. Impact of High Risk for Obstructive Sleep Apnea on Survival after Acute Coronary Syndrome: Insights from the ERICO Registry. Arq Bras Cardiol. 2017 Jan;108(1):31-37. [CrossRef] [PubMed]
- Budhiraja R, Javaheri S, Parthasarathy S, Berry RB, Quan SF. Incidence of hypertension in obstructive sleep apnea using hypopneas defined by a 3 percent oxygen desaturation or arousal but not by only 4 percent oxygen desaturation. J Clin Sleep Med. 2020 Jul 9. Epub ahead of print. PMID: 32643602.[CrossRef] [PubMed]
- Bouloukaki I, Grote L, McNicholas WT, Hedner J, Verbraecken J, Parati G, Lombardi C, Basoglu OK, Pataka A, Marrone O, Steiropoulos P, Bonsignore MR, Schiza SE; European Sleep Apnoea Database Network. Mild obstructive sleep apnea increases hypertension risk, challenging traditional severity classification. J Clin Sleep Med. 2020 Jun 15;16(6):889-898. [CrossRef] [PubMed]
- Hirotsu C, Haba-Rubio J, Andries D, Tobback N, Marques-Vidal P, Vollenweider P, Waeber G, Heinzer R. Effect of Three Hypopnea Scoring Criteria on OSA Prevalence and Associated Comorbidities in the General Population. J Clin Sleep Med. 2019 Feb 15;15(2):183-194. [CrossRef] [PubMed]
- Heinzer R, Vat S, Marques-Vidal P, Marti-Soler H, Andries D, Tobback N, Mooser V, Preisig M, Malhotra A, Waeber G, Vollenweider P, Tafti M, Haba-Rubio J. Prevalence of sleep-disordered breathing in the general population: the HypnoLaus study. Lancet Respir Med. 2015 Apr;3(4):310-8. [CrossRef] [PubMed]
- Sforza E, Roche F. Chronic intermittent hypoxia and obstructive sleep apnea: an experimental and clinical approach. Hypoxia (Auckl). 2016;499-108. [CrossRef] [PubMed]
- Ryan S. Mechanisms of cardiovascular disease in obstructive sleep apnoea. J Thorac Dis. 2018;10(Suppl 34):S4201-S4211. [CrossRef] [PubMed]
- Sulit L, Storfer-Isser A, Kirchner HL, Redline S. Differences in polysomnography predictors for hypertension and impaired glucose tolerance. Sleep. 2006;29(6):777-783. [CrossRef] [PubMed]
- Kapur VK, Resnick HE, Gottlieb DJ, for the Sleep Heart Health Study Group. Sleep Disordered Breathing and Hypertension: Does Self-Reported Sleepiness Modify the Association? Sleep. 2008;31(8):1127-1132. [CrossRef] [PubMed]
- Mazzotti DR, Keenan BT, Lim DC, Gottlieb DJ, Kim J, Pack AI. Symptom Subtypes of Obstructive Sleep Apnea Predict Incidence of Cardiovascular Outcomes. Am J Respir Crit Care Med. 2019;200(4):493-506. [CrossRef] [PubMed]
- Ogilvie RP, Lakshminarayan K, Iber C, Patel SR, Lutsey PL. Joint effects of OSA and self-reported sleepiness on incident CHD and stroke. Sleep Med. 2018 Apr;44:32-37. [CrossRef] [PubMed]
Cite as: Quan SF, Budhiraja R, Javaheri S, Parthasarathy S, Berry RB. The Association Between Obstructive Sleep Apnea Defined by 3 Percent Oxygen Desaturation or Arousal Definition and Self-Reported Cardiovascular Disease in the Sleep Heart Health Study. Southwest J Pulm Crit Care. 2020;21(4):86-103. doi: https://doi.org/10.13175/swjpcc054-20 PDF
Out of Center Sleep Testing in Ostensibly Healthy Middle Aged to Older Adults
Stuart F. Quan, M.D.1,2
Brandon J. Lockyer1
Salma Batool-Anwar, M.D., M.P.H.1
Daniel Aeschbach, Ph.D.1,3
1Division of Sleep and Circadian Disorders, Department of Medicine and Department of Neurology; Brigham and Women's Hospital and Division of Sleep Medicine, Harvard Medical School, Boston, MA
2Asthma and Airways Research Center, University of Arizona College of Medicine, Tucson, AZ
3Department of Sleep and Human Factors Research; Institute of Aerospace Medicine; German Aerospace Center; Cologne, 51147; Germany
Abstract
Background: Out of Center Sleep Testing (OCST) is used increasingly to diagnose obstructive sleep apnea (OSA). However, there are few data using OCST that quantify the amount of intrinsic apneic and hypopneic events among asymptomatic healthy persons, especially those who are elderly. This analysis reports the results of OCST in a small group of ostensibly healthy asymptomatic individuals.
Methods: The study population was comprised of ostensibly healthy middle-aged to elderly volunteers for studies of circadian physiology. Before undergoing an OCST, they were found to be free of any chronic medical or psychiatry condition by history, physical and psychologic examination and by a variety of questionnaires and laboratory tests.
Results: There were 24 subjects ranging in age from 55-70 years who had an OCST performed. Repeat studies were required in only 3 subjects. Over half the study population was over the age of 60 years (54.2% vs 45.8%); the majority were men (70.8%). The mean apnea hypopnea index (AHI) was 9.2 /hour with no difference between younger and older subjects. However, 11 had an AHI > 5 /hour. Five had an AHI >15 /hour and 2 had an AHI >40 /hour. Those with an AHI <15 /hour had a mean AHI of 4.4 /hour (95% CI:2.8-6.0 /hour).
Conclusions: Although OCST has a low failure rate, there is a high prevalence of intrinsic obstructive apnea and hypopnea in ostensibly healthy asymptomatic persons.
Introduction
Out of center sleep testing (OCST) is increasingly used instead of laboratory polysomnography (PSG) for the identification of persons with obstructive sleep apnea (OSA) (1). There have been a number of studies validating the use of OCST for this purpose (1). Consequently, large research studies now are using OCST to identify subjects with OSA for clinical trials or observational studies (2-4). Out of center sleep testing also may have a role in identifying the presence of unrecognized OSA in studies of asymptomatic normal individuals. Studies reporting on the frequency of apneic and hypopneic events in healthy individuals using current PSG monitoring techniques (5, 6) found surprisingly high prevalence rates of OSA. Similar reports using OCST also noted that OSA was common in asymptomatic volunteers, but many of these subjects still had chronic medical conditions (7, 8). Thus, there is little information on the prevalence of OSA using OCST, especially in those who are older without any co-morbidities.
In this report, we describe the results of OCST in a small group of middle-aged to older adults who were screened intensively to exclude the presence of chronic sleep and medical conditions. We hypothesized that in this group of ostensibly healthy adults the prevalence of OSA would be less than previously observed.
Methods
Potential subjects between 55 and 70 years of age were identified through public advertisements for volunteers to participate in a circadian physiology research study. The study was approved by the Partners Health Care Human Research Committee, and subjects gave written informed consent prior to their participation. Initially, 5,225 individuals were screened by telephone for medical and psychiatric exclusion criteria. Those who passed (n=90) were invited for an interview and more intensive screening which included a medical history, the Pittsburgh Sleep Quality Index (PSQI) (9), Epworth Sleepiness Scale (ESS) (10) the Berlin Questionnaire (11), blood and urine tests, an electrocardiogram, and a complete physical examination by a physician. In addition, a structured psychologic examination was conducted by a clinical psychologist along with completion of several psychological screening tests including the Geriatric Depression Scale (12), Mattis Dementia Rating Scale (13) and the Mini Mental Status Examination (14). Potential subjects also could not have worked at night for the previous 3 years or recently traveled across time zones. Those who were determined to be free from any acute or chronic medical or psychiatric condition including but not limited to obesity (body mass index, BMI < 30 kg/m2), medication use, hypertension, cardiovascular or pulmonary disease, neoplasia, and disorders of the gastrointestinal, renal, endocrine, metabolic or neurologic systems were asked to undergo an OCST.
The OCST was performed using the Embletta Gold (Embla Systems, Broomfield, CO), a Type III OCST device. The testing montage included nasal pressure, pulse oximetry, bilateral leg electromyography, and chest and abdominal inductance plethysmography. Subjects were instructed to sleep at their habitual hours during OCST. Procedure for determining lights out and lights on, sleep onset and sleep offset, and wake periods during OCST in the sleep, aging and circadian rhythm disorders is given in Appendix 1. Estimated total sleep time was ascertained by the scoring technologist on the basis of changes in the recorded signals indicative of sleep onset or offset and a questionnaire administered to the subject on the morning after the study (see online supplement for the protocol). Studies were scored for apneas, hypopneas and periodic limb movements according to the following criteria. An apnea was defined as > 90% amplitude decrease from baseline of the nasal pressure signal lasting ≥ 10 s. Hypopneas were scored if an event was at least 10 s in duration and if there was a clear amplitude reduction of the nasal pressure signal that was associated with an oxygen desaturation > 4%. Obstructive or central apneas were identified by the presence or absence of respiratory effort, respectively. The apnea hypopnea index (AHI) was calculated as the sum of all apneas and hypopneas divided by the estimated total sleep time. Periodic limb movements were identified using American Academy of Sleep Medicine criteria (15). The periodic limb movement index (PLMI) was computed as the sum of all periodic limb movements divided by the estimated total sleep time. All OCST recordings were scored by a registered polysomnographic technologist and reviewed by a board-certified sleep physician.
Six subjects who had successfully completed the circadian physiology protocol were invited again to enroll in a related protocol approximately 1-3 years later. They repeated the aforementioned screening procedures including a second OCST.
Paired and unpaired Student’s t-tests were used to compare means. Comparisons between proportions were performed using c2. Data are expressed as means ± SD or number and % of cases. Data were analyzed using IBM SPSS Statistics V24 (Armonk, NY).
Results
As shown in Table 1, there were 24 subjects who successfully underwent a screening OCST.

Their ages ranged from 55 to 70 years. Over half the study population was over the age of 60 years [13/24 (54.2 %) vs 11/24 (45.8%)], and the majority were men (70.8%). In 3 subjects, the initial OCST provided insufficient data and a repeat study was required. The mean AHI was 9.2 /hour overall and there were no differences between younger and older subjects. Notably, 11 subjects (46%) had an AHI greater than 5 /hour. Five (21%) had an AHI greater than 15 /hour and 2 subjects had an AHI greater than 40 /hour. Excluding subjects with an AHI ≥15 /hour yielded a mean AHI of 4.4 (95% CI: 2.8-6.0) /hour. Younger subjects had a higher BMI (27.1 ± 2.7 vs. 24.2 ± 3.5 kg/m2, p=0.036), tended to have a longer estimated total sleep time (9.2 ± 0.6 vs. 7.9 ± 2.1 hours, p=0.059), and a slightly lower average nocturnal oxygen saturation (94.9 ± 1.4 vs. 96.1 ± 1.4%, p=.061). No other differences were observed between young and older subjects.
In Table 2 are shown the sleep and anthropometric findings for the 6 subjects who had repeat testing.

The interval between tests ranged from 382 to 930 days (mean: 672 ± 227 days). Although there was a slight increase in BMI over this interval, no changes were noted in their sleep quality, AHI or PLMI.
Discussion
In this study, we found that it was feasible to screen an ostensibly healthy asymptomatic group of middle to older aged adults for the presence of OSA using a Level III OCST device. The results of the OCST were replicable over an interval of several years and there were few technical failures. Furthermore, evidence of OSA was observed in a substantial proportion of these individuals underscoring that the diagnosis of OSA remains unrecognized in many elderly persons.
Over the past 20 years, there have been numerous clinical trials and cohort studies that have recorded data related to the presence of OSA (2-4, 8, 16, 17). Most have used PSG recorded in the laboratory or at home (16-18). However, the use of PSG is logistically complex and expensive. Additionally, the equipment required for data acquisition may artifactually disrupt the subject’s sleep. In contrast, OCST is less intrusive and expensive, but actual sleep is not recorded. However, to our knowledge there have not been previous studies that have determined the normative values for the AHI using OCST in a group of ostensibly healthy middle-aged to older adults. In this small cohort, the mean AHI was 9.2 /hour. According to the 3rd International Classification of Sleep Disorders (19), an AHI ≥15 /hour is diagnostic of OSA even in the absence of symptoms or associated medical conditions. Therefore, after excluding those who met criteria for at least moderate OSA (i.e., AHI ≥15 hour), our findings indicate an average value of 4.4 /hour in those individuals with a “normal” AHI using OCST. In contrast, a previous study of healthy volunteers for circadian physiology research using similar inclusion and exclusion criteria found the overall mean AHI of all subjects using PSG was substantially higher; hypopneas were identified if reductions in airflow were associated with a minimum 3% oxygen desaturation or a cortical arousal (6). However, a more recent study also using PSG found AHI values more similar to our observations (5). Although it would be expected that OCST may underreport the presence of hypopneas, the explanation for the differences between the two PSG studies is unclear given that the recording montages and respiratory scoring algorithms appeared to be similar.
A striking finding from this study is the high prevalence of OSA among these carefully screened, ostensibly healthy volunteers who had no evidence of a sleep disorder based on their Berlin Questionnaire, PSQI and ESS. The AHI of 2 subjects documented the presence of severe OSA which is usually an indication for treatment. The absence of hypersomnia in a substantial proportion of persons with PSG evidence of OSA has been clearly documented (20). Our data extend these observations by demonstrating the existence of severe OSA in ostensibly healthy middle-aged to older adults. Although some data suggest that such individuals are not at risk for cardiovascular disease or other sequelae of OSA (8), whether this prognosis is correct is still not settled.
Some, but not all epidemiologic data suggest that OSA slowly worsens with age. In contrast, we observed no progression of OSA over an interval of approximately 1-2.5 years (8, 21). However, it is likely that our follow up interval was insufficient to detect a change given the small number of subjects.
In conclusion, use of OCST to screen for OSA is feasible in research studies of normal individuals. Importantly, a relatively high proportion of even ostensibly healthy individuals can be expected to show evidence of OSA.
Acknowledgements
This study was supported by P01 AG009975 from the National Institute of Aging. We would like to express our gratitude to Alec Rader and Jacob Medina for their help with subject recruitment and Stephanie Marvin for scoring support.
References
- Kapur VK, Auckley DH, Chowdhuri S, et al. Clinical Practice Guideline for Diagnostic Testing for Adult Obstructive Sleep Apnea: An American Academy of Sleep Medicine Clinical Practice Guideline. J Clin Sleep Med. 2017;13(3):479-504. [CrossRef] [PubMed]
- Gottlieb DJ, Punjabi NM, Mehra R, et al. CPAP versus oxygen in obstructive sleep apnea. N Engl J Med. 2014;370(24):2276-85. [CrossRef] [PubMed]
- Zhao YY, Wang R, Gleason KJ, et al. Effect of Continuous Positive Airway Pressure Treatment on Health-Related Quality of Life and Sleepiness in High Cardiovascular Risk Individuals with Sleep Apnea: Best Apnea Interventions for Research (BestAIR) Trial. Sleep. 2017;40(4):10.1093/sleep/zsx040. [CrossRef] [PubMed]
- Redline S, Sotres-Alvarez D, Loredo J, et al. Sleep-disordered breathing in Hispanic/Latino individuals of diverse backgrounds. The Hispanic Community Health Study/Study of Latinos. Am J Respir Crit Care Med. 2014;189(3):335-44. [CrossRef] [PubMed]
- Mitterling T, Hogl B, Schonwald SV, et al. Sleep and Respiration in 100 Healthy Caucasian Sleepers--A Polysomnographic Study According to American Academy of Sleep Medicine Standards. Sleep. 2015;38(6):867-75. [CrossRef] [PubMed]
- Pavlova MK, Duffy JF, Shea SA. Polysomnographic respiratory abnormalities in asymptomatic individuals. Sleep. 2008;31(2):241-8. [CrossRef] [PubMed]
- Sforza E, Pichot V, Martin MS, Barthelemy JC, Roche F. Prevalence and determinants of subjective sleepiness in healthy elderly with unrecognized obstructive sleep apnea. Sleep Med. 2015;16(8):981-6.[CrossRef] [PubMed]
- Sforza E, Hupin D, Pichot V, Barthelemy JC, Roche F. A 7-year follow-up study of obstructive sleep apnoea in healthy elderly: The PROOF cohort study. Respirology. 2017;22(5):1007-14. [CrossRef] [PubMed]
- Buysse DJ, Reynolds CF,3rd, Monk TH, Berman SR, Kupfer DJ. The Pittsburgh Sleep Quality Index: a new instrument for psychiatric practice and research. Psychiatry Res. 1989;28(2):193-213. [CrossRef] [PubMed]
- Johns MW. A new method for measuring daytime sleepiness: the Epworth sleepiness scale. Sleep. 1991;14(6):540-5. [CrossRef] [PubMed]
- Netzer NC, Stoohs RA, Netzer CM, Clark K, Strohl KP. Using the Berlin Questionnaire to identify patients at risk for the sleep apnea syndrome. Ann Intern Med. 1999;131(7):485-91.[CrossRef] [PubMed]
- Yesavage JA, Brink TL, Rose TL, et al. Development and validation of a geriatric depression screening scale: a preliminary report. J Psychiatr Res. 1982;17(1):37-49. [CrossRef] [PubMed]
- Mattis S. Mental status examination for organic mental syndrome in the elderly patient. In: Geriatric psychiatry. Bellak L and Karasu TE, eds. New York: Grune and Stratton, 1976; 77-121
- Pangman VC, Sloan J, Guse L. An examination of psychometric properties of the mini-mental state examination and the standardized mini-mental state examination: implications for clinical practice. Appl Nurs Res. 2000;13(4):209-213. [CrossRef] [PubMed]
- Iber C, Ancoli-Israel S, Chesson A, Quan SF. The AASM Manual for the Scoring of Sleep and Associated Events: Rules, Terminology and Technical Specifications. 1st ed. Westchester, IL: American Academy of Sleep Medicine, 2007; 57.
- Quan SF, Howard BV, Iber C, et al. The Sleep Heart Health Study: design, rationale, and methods. Sleep. 1997;20(12):1077-85. [PubMed]
- Kushida CA, Nichols DA, Quan SF, et al. The Apnea Positive Pressure Long-term Efficacy Study (APPLES): rationale, design, methods, and procedures. J Clin Sleep Med. 2006;2(3):288-300. [PubMed]
- Chen X, Wang R, Zee P, et al. Racial/Ethnic Differences in Sleep Disturbances: The Multi-Ethnic Study of Atherosclerosis (MESA). Sleep. 2015;38(6):877-88. [CrossRef] [PubMed]
- Sateia MJ. International Classification of Sleep Disorders. 3rd ed. Darien, IL: American Academy of Sleep Medicine, 2014.
- He K, Kapur VK. Sleep-Disordered Breathing and Excessive Daytime Sleepiness. Sleep Med Clin. 2017;12(3):369-82.[CrossRef] [PubMed]
- Redline S, Schluchter MD, Larkin EK, Tishler PV. Predictors of longitudinal change in sleep-disordered breathing in a nonclinic population. Sleep. 2003;26(6):703-9. [CrossRef] [PubMed]
Cite as: Quan SF, Lockyer BJ, Batool-Anwar S, Aeschbach D. Out of center sleep testing in ostensibly healthy middle aged to older adults. Southwest J Pulm Crit Care. 2019;18:87-93. doi: https://doi.org/10.13175/swjpcc016-19 PDF
Sleep Related Breathing Disorders and Neurally Mediated Syncope (SRBD and NMS)
Damian Valencia, MD1
Stella Pak, MD1
Juan Linares, MD1
Victor Valencia, BS2
Christopher Lee, MD1
John-Philip Markovic, MD1
Hemant Shah, MD1
1Department of Medicine, Kettering Medical Center, Kettering, Ohio USA
2Department of Medicine, Northwestern University Feinberg School of Medicine, Chicago, Illinois USA
Abstract
Introduction: Individuals with severe sleep related breathing disorders (SRBD) tend to experience intermittent hypoxia, sleep fragmentation and highly fluctuating intrathoracic pressures. Chronic exposure to these stressors sensitizes the parasympathetic system while suppressing the sympathetic system. Parasympathetic over-reactivity among patients with severe sleep related breathing disorders has been proposed as a predisposing factor for neurally mediated syncope.
Goal: We sought to determine the relative risk for neurally mediated syncope in patients with severe SRBD compared to the general population.
Methods: This is a retrospective cohort study of 228 cases selected from 2,598 patients who were referred for polysomnography on discharge from hospitalization. Incidence of neurally mediated syncope (NMS) was compared between patients with apnea-hypopnea-index (AHI) scores of 30 or greater and those with an AHI score below 5.
Results: Approximately 32% of patients with severe SRBD had a history of neurally mediated syncope compared to only 14% in patients with normal sleep breathing patterns (OR = 3.09, 95% CI: 1.25 - 7.62, p = 0.015).
Conclusion: Our multi-center retrospective study supports an association between SRBD and NMS.
Brief Summary
Current Knowledge/Study Rational. There are multiple reports that highlight a possible connection between sleep related breathing disorders and neurally mediated syncope. Deleterious effects on the autonomic and peripheral nervous system by severe sleep related breathing disorders have also been demonstrated. We sought to determine the association and relative risk of neurally mediated syncope in patients with severe sleep related breathing disorders.
Study Impact. Patients with severe sleep related breathing disorders are at increased risk for neurally mediated syncope. Early identification and appropriate treatment in this patient population may reduce rates of syncope, improve quality of life and clinical outcomes.
Introduction
Sleep related breathing disorders (SRBD), comprise a spectrum of disorders characterized by chronic intermittent apnea and hypopnea, which includes obstructive sleep apnea (OSA), central sleep apnea, sleep-related hypoventilation, and nocturnal hypoxemia (1). Neurally mediated syncope (NMS), also known as reflex syncope, is defined as a transient loss of consciousness secondary to decreased cerebral blood supply, typically as a result of reflexive cardiac inhibition and decreased vascular tone. NMS includes vasovagal syncope, situational syncope and carotid sinus syncope (2). Autonomic dysfunction may also play a role in cases of NMS (3). Researchers have previously documented the deleterious effects of SRBD on the autonomic and peripheral nervous system (4-7). A connection between SRBD and NMS has been proposed by some, detailing cases of patients suffering from incapacitating recurrent syncope which demonstrates dramatic improvement or resolution after diagnosis and treatment of OSA (8-10). In this study, we sought to determine the association and relative risk of neurally mediated syncope in patients with severe sleep related breathing disorders.
Methods
This retrospective cohort analysis was performed using electronic medical record data collection from hospitals within the Kettering Health Network, including Fort Hamilton Hospital (Hamilton, Ohio), Grandview Medical Center (Dayton, Ohio), Greene Memorial Hospital (Xenia, Ohio), Kettering Medical Center (Kettering, Ohio), Soin Medical Center (Beavercreek, Ohio), Southview Medical Center (Centerville, Ohio) and Sycamore Medical Center (Miamisburg, Ohio). Individuals who underwent and completed in-facility polysomnography were selected for study review. Patients under the age of 18 years old and those with a pacemaker or implantable cardiac defibrillator were excluded from the study. Patients were divided into two groups; those with severe SRBD, defined as having an Apnea-Hypopnea Index (AHI) score of/ or greater than 30, and a control group, defined as patients having an AHI score of/ or less than 5. This study was approved by the institutional review board (IRB) at Kettering Health Network.
Statistical Methods: The Kolmogorov-Smirnov and Shapiro-Wilk tests were utilized to compare baseline patient demographics between each group; control and severe SRBD group. These tests were selected to better represent the data, with median interquartile range (IQR), as outliers were included in the analysis. Categorical variables were compared using Pearson’s Chi-squared test. Continuous variables were compared using the Student’s t-test or Wilcoxon rank sum test (Mann-Whitney U test). All estimates were reported as 95% confidence intervals with p-values. Two-sided p-values less than 0.05 were considered statistically significant. Multivariate logistic regression modeling was used to determine the effects of each variable while controlling for confounding variables. Odds ratios (OR) were calculated for each type of syncope in both the severe SRBD group and control group. All statistical analyses were performed using IBM SPSS Statistics for Windows version 20.0 (IBM Corp., Armonk, NY, USA).
Results
A total of 2,598 patients were identified from the electronic medical record database, of which, only 228 patients fulfilled our inclusion criteria for severe SRBD (AHI score of/ or greater than 30), with 80 patients meeting criteria for the control group (AHI score of/ or less than 5). Among the 228 patients with severe SRBD, the most common subtype was obstructive sleep apnea (204 of 228 patients, 89.5%), followed by central sleep apnea (13 of 228 patients, 4.2%) and mixed type (11 of 228 patients, 3.6%).
Initial comparison of demographic characteristics (Table 1) was done using univariate analysis.
Table 1: Baseline Characteristics of the Individuals with and without SRBD.

SRBD: sleep-related breathing disorder, IQR: interquartile range; BMI: body-mass index; AHI: apnea-hypopnea index; LEVF: left ventricular ejection fraction; COPD: chronic obstructive pulmonary disease; N: number; N/A: not applicable.
The SRBD group and control did not statistically significance differ in age (p = 0.79). Although gender differences were noted, 62.3% male in the SRBD group compared to 47.5% in the control group (p = 0.042), there were no statistically significant differences on multivariate logistic regression (p = 0.854). Differences in body mass index (BMI) between groups were noted on univariate (p = 0.042) and multivariate models (p = 0.041), with 36.5 (IQR 31.3 – 43.8) mean BMI of the SRBD group compared to 34.4 (IQR 27.3 – 40.4) in the control group.
The incidence of pre-existing comorbidities between groups was also compared. (Table 1) There were no statistically significant differences between the groups in terms of pulmonary artery pressure (p = 0.226), diabetes (p = 0.902) and coronary artery disease (p = 0.065). Univariate analysis did reveal differences amongst left ventricular ejection fraction (LVEF), 31.1% of patients with SRBD had LVEF <55% compared to only 17.5% in the control group (p = 0.19), hypertension (HTN), 75.4% of patients with SRBD had HTN compared to only 53.8% in the control group (p < 0.001), and chronic obstructive pulmonary disease (COPD), 29.8% of patients with SRBD compared to 43.8% in the control group (p = 0.023). These findings were not statistically significant on multivariate logistic regression; LVEF<55% (p = 0.326), HTN (p = 0.585), COPD (p = 0.576).
The mean apnea hypopnea index (AHI) for the severe SRBD group was 53.2 (38.7-80.2), compared to 1.6 (0-2.6) in the control group (p < 0.001). The prevalence of NMS was higher in the SRBD group compared to the control group, 32% (73 of 228 patients) and 14% (11 of 80 patients), respectively; χ2 (2, N=308) = 9.96, p = 0.001. Prevalence of non-neurally mediated syncope did not differ significantly between the SRBD group and control group, 1% (2 of 228 patients) and 0% (no patients), respectively; Pearson’s Chi-squared test p = 0.571. Approximately 32% of patients with severe SRBD had a history of neurally mediated syncope compared to only 14% in patients with normal sleep breathing patterns (OR = 3.09, 95% CI: 1.25 - 7.62, p = 0.015). (Table 2).
Table 2: Multivariate Logistic Regression Modeling, Odds Ratio (OR) for Neurally Mediated Syncope.

CI: confidence interval; BMI: body mass index; AHI: apnea-hypopnea index; LEVF: left ventricular ejection fraction; COPD: chronic obstructive pulmonary disease.
Situational syncope has not been consistently recorded, OR and CI were not calculated.
Discussion
This study suggests that individuals with severe sleep related breathing disorders are at increased risk for developing neurally mediated syncope. Chrysostomakis et al. (11) showed that parasympathetic activity is increased during the night in patients with obstructive sleep apnea and that continuous positive airway pressure (CPAP) treatment may restore autonomic balance. Puel et al. (8) suggested that intermittent hypoxia, sleep fragmentation and variations of intra-thoracic pressures may result in chronic adaptations to the autonomic nervous system, which may predispose patients to vasovagal syncope. Cintra et al. (12) noted that patients with vasovagal syncope exhibited sympathetic suppression during rapid eye movement (REM) sleep. Previous studies indicate that chronic intermittent hypoxia can also increase activation of free-radical oxidation, which in turn can elicit rapid and sustained expression of pro-inflammatory cytokines (12). This oxidative stress and inflammatory response can induce tissue damage and intermittent academia, eventually leading to up-regulation of pH sensitive ion channels on chemo-afferent neurons at the carotid bodies. Overexpression of these channels potentiates the carotid body response to changes in arterial oxygen saturation (12). It is possible that this mechanism also contributes to the higher prevalence of carotid sinus hypersensitivity and syncope among patients with severe SRBD. In accordance with our findings, there have been reported cases of recurrent syncope, which have resolved with correction of underlying SRBD (8-10). Appropriate management of SRBD in this patient population may reduce rates of NMS. Given the high prevalence of SRBD and neurally mediated syncope in the United States, further investigation is warranted to delineate the association between the two disease processes and the mechanisms which are involved.
Study Limitations
Our retrospective study design has limited control over consistency and accuracy. This study did not use any matching algorithm to match the control group to the individuals with severe SRBD for baseline characteristics. We did not utilize a caliper matching process to identify controls, and as a result, the control cohort was smaller than the study cohort. The diagnosis of vasovagal syncope was made based on clinical presentation. All patients who were diagnosed with vasovagal syncope did not have confirmatory tilt-table testing, limiting diagnostic accuracy and consistency.
Conclusion
Our study suggests that individuals with severe sleep-related breathing disorders (SRBD) are approximately 3 times (OR = 3.09, 95% CI: 1.25 - 7.62, p = 0.015) more likely to have experienced neurally mediated syncope (NMS) compared to case matched controls.
Acknowledgement
Rosaria Jordan (table/figure formatting)
References
- Tsara V, Amfilochiou A, Papagrigorakis M, Georgopoulos D, Liolios E. Guidelines for diagnosis and treatment of sleep-related breathing disorders in adults and children. Definition and classification of sleep related breathing disorders in adults: Different types and indications for sleep studies (part 1). Hippokratia. 2009;13:187-91. [PubMed]
- Alboni P, Brignole M, Menozzi C, et al. Diagnostic value of history in patients with syncope with or without heart disease. J Am Coll Cardiol. 2001;37(7):1921-8. [CrossRef] [PubMed]
- Mosqueda-Garcia R, Furlan R, Tank J, Fernandez-Violante R. The elusive pathophysiology of neurally mediated syncope. Circulation. 2000;102(23):2898-2906. [CrossRef] [PubMed]
- Li Y, Veasey SC. Neurobiology and neuropathophysiology of obstructive sleep apnea. NeuroMolecular Med. 2012;14(3):168-179. doi:10.1007/s12017-011-8165-7. [CrossRef] [PubMed]
- Gozal D, Daniel JM, Dohanich GP. Behavioral and anatomical correlates of chronic episodic hypoxia during sleep in the rat. J Neurosci. 2001;21(7):2442-50. [PubMed]
- Mayer P, Dematteis M, Pépin JL, et al. Peripheral neuropathy in sleep apnea: A tissue marker of the severity of nocturnal desaturation. Am J Respir Crit Care Med. 1999;159(1):213-9. [CrossRef] [PubMed]
- Dziewas R, Schilling M, Engel P, et al. Treatment for obstructive sleep apnoea: effect on peripheral nerve function. J Neurol Neurosurg Psychiatry. 2007;78(3):295-7. [CrossRef] [PubMed]
- Puel V, Pepin JL, Gosse P. Sleep related breathing disorders and vasovagal syncope, a possible causal link? Int J Cardiol. 2013;168(2):1666-7. [CrossRef] [PubMed]
- Barone D, Fine L, Bhandari N, Ana C. Syncope in hypoxemic respiratory arrest. J Sleep Med Disord. 2015;2(2):2-4. [CrossRef].
- Willis FB, Isley AL, Geda YE, Shaygan A, Quarles L, Fredrickson P a. Resolution of syncope with treatment of sleep apnea. J Am Board Fam Med. 2008;21(5):466-8. [CrossRef] [PubMed]
- Chrysostomakis SI, Simantirakis EN, Schiza SE, et al. Continuous positive airway pressure therapy lowers vagal tone in patients with obstructive sleep apnoea-hypopnoea syndrome. Hell J Cardiol. 2006;47(1):13-20. [PubMed]
- Cintra F, Poyares D, DO Amaral A, et al. Heart rate variability during sleep in patients with vasovagal syncope. Pacing Clin Electrophysiol. 2005;28(12):1310-6. [CrossRef] [PubMed]
Cite as: Valencia D, Pak S, Linares J, Valencia V, Lee C, Markovic J-P, Shah H. Sleep related breathing disorders and neurally mediated syncope (SRBD and NMS). Southwest J Pulm Crit Care. 2019;18(4):76-81. doi: https://doi.org/10.13175/swjpcc015-19 PDF
Obstructive Sleep Apnea and Quality of Life: Comparison of the SAQLI, FOSQ, and SF-36 Questionnaires
Graciela E Silva PhDa
James L Goodwin PhDb
Kimberly D Vana, DNP, RN, FNP-BC, FNP- Cc
Stuart F Quan MDb,d,e,f
aUniversity of Arizona College of Nursing, Tucson, AZ; bArizona Respiratory Center, University of Arizona, Tucson, AZ; cCollege of Nursing & Health Innovation, Arizona State University, Phoenix, AZ; dCollege of Medicine, University of Arizona, Tucson, AZ; eDivision of Sleep Medicine, Harvard Medical School, Boston, MA. fDivision of Sleep and Circadian Disorders, Brigham and Women’s Hospital, Boston, MA
Abstract
Introduction: The impact of sleep on quality of life (QoL) has been well documented; however, there is a great need for reliable QoL measures for persons with obstructive sleep apnea (OSA). We compared the QoL scores between the 36-Item Short Form of the Medical Outcomes Survey (SF-36), Calgary Sleep Apnea Quality of Life Index (SAQLI), and Functional Outcomes Sleep Questionnaire (FOSQ) in persons with OSA.
Methods: A total of 884 participants from the Sleep Heart Health Study second examination, who completed the SF-36, FOSQ, and SAQLI, and in-home polysomnograms, were included. The apnea hypopnea index (AHI) at 4% desaturation was categorized as no OSA (<5 /hour), mild to moderate OSA (5-30 /hour) and severe OSA (>30 /hour). QoL scores for each questionnaire were determined and compared by OSA severity category and by gender.
Results: Participants were 47.6% male, 49.2% (n=435) had no OSA, 43.2% (n=382) had mild to moderate OSA, and 7.6% (n=67) had severe OSA. Participants with severe OSA were significantly older (mean age = 63.7 years, p <.0001), had higher BMI (mean = 34.3 kg/m2, p <.0001) and had lower SF-36 Physical Component scores (PCS) (45.1) than participants with no OSA (48.5) or those with mild to moderate OSA (46.5, p= .006). When analyzed according to gender, no significant differences were found in males for QoL by OSA severity categories. However, females with severe OSA had significantly lower mean scores for the SAQLI (5.4, p= .006), FOSQ (10.9, p= .02), and SF-36 PCS (37.7, p<.0001) compared to females with no OSA (6.0, 11.5, 44.6) and those with mild to moderate OSA (5.9, 11.4, 48, respectively). Females with severe OSA also had significantly higher mean BMI (41.8 kg/m2,) than females with no OSA (26.5 kg/m2) or females with mild to moderate OSA (30.6 kg/m2, p<.0001). The SF-36 PCS and Mental Component Scores (MCS) were correlated with the FOSQ and SAQLI (r=.37 PCS vs FOSQ; r=.31 MCS vs FOSQ; r=.42 PCS vs SAQLI; r=.52 MCS vs SAQLI; and r=.66 FOSQ vs SAQLI, p<.001 for all correlations). Linear regression analyses, adjusting for potential confounders, indicated that the impact of OSA severity on QoL is largely explained by the presence of daytime sleepiness.
Conclusion: The impact of OSA on QoL differs between genders with a larger effect on females and is largely explained by the presence of daytime sleepiness. Correlations among QoL instruments are not high and various instruments may assess different aspects of QoL.
Introduction
Obstructive sleep apnea (OSA) is a highly prevalent condition occurring in as many as 17% and 9% of middle aged males and females, respectively (1). OSA is now recognized as an important risk factor for the development of hypertension and coronary heart disease as well as premature death (2). However, patients frequently present to health care providers with symptoms that are indicative of impairment in their quality of life (QoL). Improvement in QoL is an important determinant of whether patients adhere to continuous positive airway pressure (CPAP), the most commonly prescribed treatment for OSA. Additionally, measurement of QoL is one of the quality metrics recently developed for use in clinical practice (3) thus increasing the importance of evaluating tools used to assess QoL in OSA.
A variety of tools to measure QoL have been utilized in epidemiologic studies and clinical trials of OSA. The most common general QoL instrument used has been the Medical Outcomes Study Short-Form Health Survey SF-36 (4). More recently, two sleep specific QoL questionnaires have been developed, the Functional Outcomes of Sleep Questionnaire (FOSQ) (5) and the Sleep Apnea Quality of Life Inventory (SAQLI) (6). Whether these sleep specific QoL instruments are more sensitive in those with OSA than general QoL questionnaires is not clear. Furthermore, there have been few comparisons of the FOSQ to the SAQLI with respect to their sensitivity in those with OSA and whether QoL differs between males and females. Using data from a large cohort study, the purposes of these analyses were to compare these instruments to each other, to assess whether they were able to detect differences in QoL among groups with different severities of OSA and to determine whether there were differences between genders.
Methods
The Sleep Heart Health Study (SHHS) is a prospective multicenter cohort study designed to investigate the relationship between OSA and cardiovascular diseases in the United States. Details of the study design have been published elsewhere (7). Briefly, initial baseline recruitment began in 1995, enrolling 6,441 subjects, 40 years of age and older, from several ongoing geographically distinct cardiovascular and respiratory disease cohorts who were initially assembled between 1976 and 1995 (8). These cohorts included the Offspring Cohort and the Omni Cohort of the Framingham Heart Study in Massachusetts; the Hagerstown, MD, and Minneapolis, MN, sites of the Atherosclerosis Risk in Communities Study; the Hagerstown, MD, Pittsburgh, PA, and Sacramento, CA, sites of the Cardiovascular Health Study; 3 hypertension cohorts (Clinic, Worksite, and Menopause) in New York City; the Tucson Epidemiologic Study of Airways Obstructive Diseases and the Health and Environment Study; and the Strong Heart Study of American Indians in Oklahoma, Arizona, North Dakota, and South Dakota. A SHHS follow-up examination took place between February 2000 and May 2003, enrolling 4,586 of the original participants who had a repeat polysomnogram in addition to completing questionnaires and undergoing other measurements. The present study focused on 884 participants from the Tucson and Framingham sites of the Sleep Heart Health Study second examination in whom data were available from the sleep habits questionnaire, all quality of life questionnaires, and in-home polysomnograms. Data was limited to these sites because administration of the FOSQ was not done at the other field centers.
The SHHS was approved by the respective institutional review boards for human subjects research, and informed written consent was obtained from all subjects at the time of their enrollment into each stage of the study.
Polysomnography
Participants underwent overnight in-home polysomnograms using the Compumedics Portable PS-2 System (Abbottsville, Victoria, Australia) administered by trained technicians (9). Briefly, after a home visit was scheduled, the Sleep Health Questionnaire, SF-36, SAQLI, and FOSQ questionnaires generally were mailed 1 to 2 weeks prior to the in-home polysomnography appointment. Each participant was asked to complete the questionnaire before the home visit, at which time the questionnaires were collected and verified for completeness. The home visits were performed by two-person, mixed-sex teams in visits that lasted 1.5 to 2 hours. There was emphasis on making the night of the polysomnographic assessment as representative as possible of a usual night of sleep. Participants were asked to schedule the visit so that it would occur approximately two hours prior to their usual bedtime. Participants’ weekday or weekend bedtime routines were encouraged to be consistent with the day of the week that the visits were made.
The SHHS recording montage consisted of electroencephalogram (C4/A1 and C3/A2), right and left electrooculogram, a bipolar submental electromyogram, thoracic and abdominal excursions (inductive plethysmography bands), airflow (detected by a nasal-oral thermocouple [Protec, Woodinville, WA]), oximetry (finger pulse oximetry [Nonin, Minneapolis, MN]), electrocardiogram and heart rate (using a bipolar electrocardiogram lead), body position (using a mercury gauge sensor), and ambient light (on/off, by a light sensor secured to the recording garment). Sensors were placed, and equipment was calibrated during an evening home visit by a certified technician. After technicians retrieved the equipment, the data, stored in real time on PCMCIA cards, were downloaded to the computers of each respective clinical site, locally reviewed, and forwarded to a central reading center (Case Western Reserve University, Cleveland, OH). Comprehensive descriptions of polysomnography scoring and quality-assurance procedures have been previously published (9, 10). In brief, sleep was scored according to guidelines developed by Rechtschaffen and Kales (11, 12). Strict protocols were maintained to ensure comparability among centers and technicians. Intra-scorer and inter-scorer reliabilities were high (10). As in previous analyses of SHHS data, an apnea was defined as a complete or almost complete cessation of airflow, as measured by the amplitude of the thermocouple signal, lasting at least 10 seconds. Hypopneas were identified if the amplitude of a measure of flow or volume (detected by the thermocouple or thorax or abdominal inductance band signals) was reduced discernibly (at least 25% lower than baseline breathing) for at least 10 seconds and did not meet the criteria for apnea. For this study, only apneas or hypopneas associated with a 4% or greater oxyhemoglobin desaturation were considered in the calculation of the apnea hypopnea index (AHI, apneas plus hypopneas per hour of total sleep time).
Sleep Habits Questionnaire and Covariates
Participants completed the SHHS Sleep Habits Questionnaire (13). The Sleep Habits Questionnaire contained questions regarding sleep habits. Height and weight were measured directly to determine body mass index (BMI, kg/m2). Sex and ethnicity were derived from data obtained from the SHHS parent cohorts. Participants answered yes or no to having a healthcare provider diagnosing them as having chronic obstructive pulmonary disease (COPD), chronic bronchitis, or asthma.
Sleepiness
The level of daytime sleepiness was determined using the Epworth Sleepiness Scale (ESS), a validated 8-item questionnaire that measures subjective sleepiness (14). Subjects were asked to rate how likely they are to fall asleep in different situations. Each question was answered on a scale of 0 to 3. ESS values ranged from 0 (unlikely to fall asleep in any situation) to 24 (high chance of falling asleep in all 8 situations). Mean ESS scores between 14 and 16 have been reported for patients with OSA (14, 15). Scores of 11 or greater are considered to represent an abnormal degree of daytime sleepiness (16). Sleepiness was defined as an ESS of at least 10.
Quality of Life Measures
Medical Outcomes Study Short-Form Health Survey (SF-36). Quality of life was evaluated using the Medical Outcomes Study Short-Form Health survey (SF-36) (4). The SF-36 is a multipurpose self-administered health survey consisting of 36 questions divided into 8 individual domains: (1) physical functioning (limitations in physical activity because of health problems), (2) role physical (limitations in usual role activities because of physical health problems), (3) bodily pain, (4) general health perceptions; (5) vitality (energy and fatigue), (6) social functioning (limitation in social activities because of physical or emotional problems), (7) role emotional (limitation in usual role activities because of emotional problems), and (8) general mental health. In addition, the 8 scales are used to form 2 distinct high-order summary scales: the physical component summary (PCS) and the mental component summary (MCS) (17). The PCS includes the physical functioning, role physical, bodily pain, and general health scales, and the MCS includes the vitality, social functioning, role emotional, and general mental health scales. The raw scores for each subscale and the 2 summary measures are standardized, weighted, and scored according to specific algorithms. The scores for the multifunction item scales and the summary measures range from 0 to 100, with higher scores indicating better quality of life. For the present study, we use only the PCS and MCS scales.
Functional Outcomes Sleep Questionnaire (FOSQ). The FOSQ was developed as a self-report instrument to assess the disorders of sleepiness on quality of life. It consists of 30 items with 5 factor-based subscales: activity level, vigilance, intimacy and sexual relationships, general productivity and social outcome. A mean weighted item score is obtained for each subscale. The subscales are summed to produce a global score (5). In SHHS, questions related to sexual intimacy were omitted because there were concerns that some participants would find these embarrassing or offensive.
Sleep Apnea Quality of Life Index (SAQLI). The SAQLI was developed as a sleep apnea specific quality of life instrument (6). It is a 35 item instrument that captures the adverse impact of sleep apnea on 4 domains: daily functioning, social interactions, emotional functioning, and symptoms. Items are scored on a 7-point scale with “all of the time” and “not at all” being the most extreme responses. Item and domain scores are averaged to yield a composite total score between 1 and 7. Higher scores represent better quality of life. In SHHS, the short form of the SAQLI was administered, because it allowed for self-completion by the participants (18).
Statistical Analysis
Differences in proportions for descriptive characteristics between OSA severity categories, and categorical variables were analyzed using Chi-square tests with 2 degrees of freedom. Fisher’s exact test was used when the expected frequency was less than 5 in any cell. One-way analyses of variance (ANOVA) were used to compare differences in mean values for continuous variables (BMI, total sleep time, SAQLI, FOSQ, SF-36 MCS, and SF-36 PCS) by OSA severity categories and by these categories separately for males and females. Pearson’s correlations were used to test for correlation coefficients between the four quality of life scales, SAQLI, FOSQ, SF-36 MCS, and SF-36 PCS.
Separate multivariate linear regression models were fitted to evaluate scores from each of the four QoL scales by OSA categories for males and females. Potential confounders (age, race, COPD, chronic bronchitis, ESS and asthma) were evaluated and adjusted for in the models; only those variables with significant coefficients were kept in the models. Thus, OSA severity, ESS, and asthma were the only variables retained in the final models. All statistical tests were performed using statistical software (Stata SE, version 13.0 for Windows; Stata Corp; College Station, TX) and a significance level of 0.05.
Results
Participants were 47.6% male and 52.4% female, 49.2% (n=435) had no OSA, 43.2% (n=382) had mild to moderate OSA, and 7.6% (n=67) had severe OSA. Approximately 21% of participants with mild to moderate OSA and 39% of those with severe OSA reported excessive daytime sleepiness (ESS >10) (Table 1).

Participants with severe OSA were significantly older (mean age = 63.7 years, p <.0001), had higher BMI (mean = 34.3 kg/m2, p <.0001) and had lower SF-36 PCS scores (45.1, p= .006) than participants with no OSA or those with mild to moderate OSA. There was also a trend towards lower scores on the MCS of the SF-36, the SAQLI, and the FOSQ (Table 2).

When analyzed according to gender, no significant differences were found in males for QoL by OSA severity categories (Table 3).

Males with severe OSA had significantly higher BMI (mean 31.9, p<.0001) than males with no OSA or males with mild to moderate OSA. However, as shown in Table 4, females with severe OSA had significantly lower mean scores for the SAQLI (5.4, p= .006), FOSQ (10.9, p= .02), and SF-36 PCS (37.7, p<.0001) compared to females with no OSA and those with mild to moderate OSA.

Females with severe OSA also had significantly higher BMI (mean 41.8, p<.0001) than females with no OSA or females with mild to moderate OSA.
As shown in Table 5, comparisons between the QoL measures showed small correlations between the FOSQ and the SF-36 MCS (r=.31, p < .001) and the SF-36 PCS (r=.37, p <.001), and medium correlations between the SAQLI and the SF-36 MCS (r=0.52, p <.001) and the SF-36 PCS (r=.42, p < .001).

The correlation between the SAQLI and FOSQ was 0.66, p <.001, and the correlation between SF-36 MCS and SF-36 PCS was -.024, however this was not significant (p = .142). In addition, ESS scores were inversely correlated with the SAQLI (r = -.36), FOSQ (r = -.43), MCS (r = -.17), and PCS (r = -.16) (data not shown).
Because categorical analyses showed no difference for males in QoL scores, we, therefore, ran linear regression models separately for females and males (Table 6).

Discussion
In these analyses using a general (SF-36) and two sleep specific QoL assessment tools (FOSQ and SAQLI), we found that QoL was reduced in those with severe OSA; substantial differences were not apparent among participants with mild to moderate OSA and those with no OSA. However, there were significant gender disparities. Females with severe OSA demonstrated a substantial reduction in QoL with all instruments, but there was a lack of differences among males by OSA severity. The reductions in QoL were explained primarily by the presence of sleepiness. Furthermore, correlations among QoL questionnaires were modest at best, indicating that they assess different QoL domains.
When males and females were analyzed together in our study, only the PCS of the SF-36 showed a significant reduction in QoL in participants with OSA, but this was limited solely to participants with severe OSA. Additional studies also have found lower QoL only in those with severe OSA (19, 20). Moreover, other studies have failed to find any differences in QoL among participants with a broad spectrum of OSA severity (21-23). In one of these studies, Lee and colleagues (22) found that the AHI was not associated with differences in the PCS or MCS of the SF-36 in a large group of patients seen in a sleep clinic. In their study, other factors, such as age, gender, minimum oxygen saturation, sleepiness, and depression were associated with the PCS or MCS scores. Our study also found a strong trend between sleepiness and QoL scores for females and males. Similarly, in a smaller study, Lee et al. (22) did not find differences in the SAQLI among OSA patients of different severities. Our data also are consistent with a previous analysis from the first examination of SHHS in which severe OSA was associated with worse QoL on most subscales of the SF-36, but only the vitality subscale was reflective of poorer QoL in participants with OSA of less severity. In contrast, even mild OSA was associated with reduced QoL in comparison to no OSA among the middle-aged males and females of the Wisconsin Sleep Cohort (24). However, our cohort was older than participants in the Wisconsin Sleep Cohort and only a small sample from the SHHS was analyzed in the present study. Thus, age and other demographic differences among the cohorts may provide explanations for these discrepancies. Nevertheless, despite the absence of large cross-sectional differences in QoL as a function of OSA severity, in most studies, the SF-36, SAQLI, and FOSQ have been shown to be sensitive to changes in QoL after OSA treatment.
When analysis of our data was performed separately according to gender, we observed that the reduction in QoL with severe OSA was limited to females irrespective of the QoL instrument. Other studies (22) also have noted that QoL in participants with OSA is worse in women. However, in a study of a large cohort of males, Appleton et al.,(25) found that increasing AHI was associated with lower QoL on the SF-36, but only in those less than 69 years of age. The median age of the SHHS cohort is 60 years with substantial numbers of participants older than 70 years. Thus, our results and those of Appleton et al. (25) may not be discrepant necessarily.
Excessive daytime sleepiness is one of the most common symptoms in OSA, and sleepiness can have a profound negative impact on QoL. Thus, not surprisingly, our multivariate analyses demonstrated that the negative impact of severe OSA was explained primarily by the presence of sleepiness. Our finding is consistent with the findings of some, (19, 22, 23, 26) but not all previous studies (27). The explanation for these inconsistent findings is not readily apparent, but possibilities include whether study populations were recruited from the general population or clinic, as well as whether the cohorts had other co-morbidities that would impact QoL. A differential perception of sleepiness between males and females offers a possible explanation of the greater impact of OSA on QoL in the latter. However, this assertion seems unlikely inasmuch as previous studies indicate females with OSA are more likely to report fatigue rather than sleepiness (28-30).
We observed that correlations among the SF-36, SAQLI, and FOSQ were relatively weak to moderate. Our results are consistent with the few studies that have done similar comparisons. In a Spanish multicenter study (21), correlations of the FOSQ and several scales of the SF-36 with the 4 domains of the SAQLI were poor to moderate. They ranged from r=.179 between the FOSQ and SAQLI Emotional Functioning domain to r=.579 for the SF-36 Vitality and SAQLI Daily Functioning domain. In a Polish study (31), the correlation between the SF-36 and the FOSQ was r=.46 and between the SF-36 and the SAQLI was r=.47. Other studies have compared the SF-36 to other general QoL instruments in patients with OSA, with some, but not all, demonstrating reasonable correspondence (32, 33). Considering our results with other studies, various instruments may sample different aspects of QoL. Care should be exercised when selecting a tool to assess health outcomes in OSA.
There are several important limitations to our findings. First, the SHHS cohort was recruited from participants enrolled in other longitudinal studies, many of whom were long-time participants. These individuals may represent a group of survivors who would generally have better QoL regardless of OSA-severity status. Second, as a group, the SHHS cohort is older (mean age = 61.6 years) and may not be representative of the US adult population. Third, SHHS is a general population cohort, and thus, unlike a clinical cohort, some did not have symptoms of OSA. Finally, severity of OSA may not be best reflected by the AHI. Other markers of severity such as amount of oxygen desaturation or degree of sleep fragmentation may be better surrogates to show differences in QoL. Nevertheless, despite these limitations, our analyses have some unique qualities such as a well-characterized, racially and ethnically diverse cohort, use of home-based polysomnography to assess the severity of OSA, and data related to QoL derived from 3 different instruments.
In conclusion, in a middle-aged to elderly cohort, QoL is poorer only in females with severe OSA. To a large extent, these findings can be explained by the presence of daytime sleepiness. Correlations among 3 commonly used QoL instruments used in persons with OSA were weak to moderate, suggesting that each samples different aspects of QoL. Therefore, care should be exercised in selecting a QoL tool for documenting health care outcomes for research or clinical care.
Acknowledgments
The Sleep Heart Health Study (SHHS) acknowledges the Atherosclerosis Risk in Communities Study (ARIC), the Cardiovascular Health Study (CHS), the Framingham Heart Study (FHS), the Cornell/Mt. Sinai Worksite and Hypertension Studies, the Strong Heart Study (SHS), the Tucson Epidemiologic Study of Airways Obstructive Diseases (TES) and the Tucson Health and Environment Study (H&E) for allowing their cohort members to be part of the SHHS and for permitting data acquired by them to be used in the study. SHHS is particularly grateful to the members of these cohorts who agreed to participate in SHHS as well. SHHS further recognizes all of the investigators and staff who have contributed to its success. A list of SHHS investigators, staff and their participating institutions is available on the SHHS website, http://www.jhucct.com/shhs/
The opinions expressed in the paper are those of the authors and do not necessarily reflect the views of the Indian Health Service.
This work was supported by HL U01HL53940 (University of Washington), U01HL53941 (Boston University), U01HL53938 and U01HL53938-07S (University of Arizona), U01HL53916 (University of California, Davis), U01HL53934 (University of Minnesota), U01HL53931 (New York University), U01HL53937 and U01HL64360 (Johns Hopkins University), U01HL63463 (Case Western Reserve University), and U01HL63429 (Missouri Breaks Research).
Dr. Silva was supported by NHLBI grant HL 062373-05A2.
References
- Peppard PE, Young T, Barnet JH, Palta M, Hagen EW, Hla KM. Increased prevalence of sleep-disordered breathing in adults. Am J Epidemiol. 2013 May 1;177(9):1006-14. [CrossRef] [PubMed]
- Budhiraja R, Quan SF. Sleep-disordered breathing and cardiovascular health. Curr Opin Pulm Med. 2005 Nov;11(6):501-6. [CrossRef] [PubMed]
- Aurora RN, Collop NA, Jacobowitz O, Thomas SM, Quan SF, Aronsky AJ. Quality measures for the care of adult patients with obstructive sleep apnea. J Clin Sleep Med. 2015 Mar 15;11(3):357-83. [CrossRef] [PubMed]
- Ware JE Jr, Sherbourne CD. The MOS 36-item short-form health survey (SF-36). I. Conceptual framework and item selection. Med Care. 1992 Jun;30(6):473-83. [CrossRef] [PubMed]
- Weaver TE, Laizner AM, Evans LK, Maislin G, Chugh DK, Lyon K, Smith PL, Schwartz AR, Redline S, Pack AI, Dinges DF. An instrument to measure functional status outcomes for disorders of excessive sleepiness. Sleep. 1997 Oct;20(10):835-43. [PubMed]
- Flemons WW, Reimer MA. Development of a disease-specific health-related quality of life questionnaire for sleep apnea. Am J Respir Crit Care Med. 1998 Aug;158(2):494-503. [CrossRef] [PubMed]
- Quan SF, Howard BV, Iber C, Kiley JP, Nieto FJ, O'Connor GT, Rapoport DM, Redline S, Robbins J, Samet JM, Wahl PW.The Sleep Heart Health Study: design, rationale, and methods. Sleep. 1997 Dec;20(12):1077-85. [PubMed]
- Lind BK, Goodwin JL, Hill JG, Ali T, Redline S, Quan SF. Recruitment of healthy adults into a study of overnight sleep monitoring in the home: experience of the Sleep Heart Health Study. Sleep Breath. 2003 Mar;7(1):13-24. [CrossRef] [PubMed]
- Redline S, Sanders MH, Lind BK, Quan SF, Iber C, Gottlieb DJ, Bonekat WH, Rapoport DM, Smith PL, Kiley JP. Methods for obtaining and analyzing unattended polysomnography data for a multicenter study. Sleep Heart Health Research Group. Sleep. 1998 Nov 1;21(7):759-67. [PubMed]
- Whitney CW, Gottlieb DJ, Redline S, Norman RG, Dodge RR, Shahar E, Surovec S, Nieto FJ. Reliability of scoring respiratory disturbance indices and sleep staging. Sleep. 1998 Nov 1;21(7):749-57. [PubMed]
- Rechtschaffen A, Kales A. Manual of standardized techniques and scoring system for sleep stages of human subjects. Los Angeles: UCLA Brain Information Service and Brain Research Institute; 1968.
- Rechtschaffen A, Kales A. Manual of standardized techniques and scoring system for sleep stages of human subjects. Los Angeles: UCLA Brain Information Service and Brain Research Institute; 1968.
- Sleep Heart Heath Study Sleep Habits Questionnaire. Available at: https://biolincc.nhlbi.nih.gov/static/studies/shhs/SHHS_1_Forms/SHHS_1_Sleep_Habits_Questionnaire_-_MN.pdf (accessed 9/24/16).
- Johns MW. Reliability and factor analysis of the Epworth Sleepiness Scale. Sleep. 1992 Aug;15(4):376-81. [PubMed]
- Hardinge FM, Pitson DJ, Stradling JR. Use of the Epworth Sleepiness Scale to demonstrate response to treatment with nasal continuous positive airways pressure in patients with obstructive sleep apnoea. Respir Med. 1995 Oct;89(9):617-20. [CrossRef] [PubMed]
- Johns MW. A new method for measuring daytime sleepiness: the Epworth sleepiness scale. Sleep. 1991 Dec;14(6):540-5. [PubMed]
- Ware JE Jr., SF-36 Physical and Mental Health Summary Scales: a User's Manual. Boston, MA; Health Assesment Lab, New England Medical Center. 1994.
- Reimer MA, Flemons WW. Quality of life in sleep disorders. Sleep Med Rev. 2003 Aug;7(4):335-49. [CrossRef] [PubMed]
- Batool-Anwar S, Goodwin JL, Kushida CA, Walsh JA, Simon RD, Nichols DA, Quan SF. Impact of continuous positive airway pressure (CPAP) on quality of life in patients with obstructive sleep apnea (OSA). J Sleep Res. 2016 May 30. [CrossRef] [PubMed]
- Lopes C, Esteves AM, Bittencourt LR, Tufik S, Mello MT. Relationship between the quality of life and the severity of obstructive sleep apnea syndrome. Braz J Med Biol Res. 2008 Oct;41(10):908-13. [CrossRef] [PubMed]
- Catalán P, Martínez A, Herrejón A, Martínez-García MÁ, Soler-Catalu-a JJ, Román-Sánchez P, Pinel J, Blanquer R. Internal consistency and validity of the Spanish version of the quality of life questionnaire specific for obstructive sleep apnea: sleep apnea quality of life index. Arch Bronconeumol. 2012 Dec;48(12):431-42. [CrossRef] [PubMed]
- Lee W, Lee SA, Ryu HU, Chung YS, Kim WS. Quality of life in patients with obstructive sleep apnea: Relationship with daytime sleepiness, sleep quality, depression, and apnea severity. Chron Respir Dis. 2016 Feb;13(1):33-9. [CrossRef] [PubMed]
- Ye L, Liang ZA, Weaver TE. Predictors of health-related quality of life in patients with obstructive sleep apnoea. J Adv Nurs. 2008 Jul;63(1):54-63. [CrossRef] [PubMed]
- Finn L, Young T, Palta M, Fryback DG. Sleep-disordered breathing and self-reported general health status in the Wisconsin Sleep Cohort Study. Sleep. 1998 Nov 1;21(7):701-6. [PubMed]
- Appleton SL, Vakulin A, McEvoy RD, Vincent A, Martin SA, Grant JF, Taylor AW, Antic NA, Catcheside PG, Wittert GA, Adams RJ. Undiagnosed obstructive sleep apnea is independently associated with reductions in quality of life in middle-aged, but not elderly men of a population cohort. Sleep Breath. 2015 Dec;19(4):1309-16. [CrossRef] [PubMed]
- Siccoli MM, Pepperell JC, Kohler M, Craig SE, Davies RJ, Stradling JR. Effects of continuous positive airway pressure on quality of life in patients with moderate to severe obstructive sleep apnea: data from a randomized controlled trial. Sleep. 2008 Nov;31(11):1551-8. [PubMed]
- Szentkirályi A, Madarász CZ, Novák M. Sleep disorders: impact on daytime functioning and quality of life. Expert Rev Pharmacoecon Outcomes Res. 2009 Feb;9(1):49-64. [CrossRef] [PubMed]
- Chervin RD. Sleepiness, fatigue, tiredness, and lack of energy in obstructive sleep apnea. Chest. 2000 Aug;118(2):372-9. [CrossRef] [PubMed]
- Chervin RD. Epworth sleepiness scale? Sleep Med. 2003 May;4(3):175-6. [CrossRef] [PubMed]
- Tamanna S, Geraci SA. Major sleep disorders among women: (women's health series). South Med J. 2013 Aug;106(8):470-8. [CrossRef] [PubMed]
- Kasibowska-Kuźniar K, Jankowska R, Kuźniar T, Brzecka A, Piesiak P, Zwierzycki J. [Comparative evaluation of two health-related quality of life questionnaires in patients with sleep apnea]. [Article in Polish] Wiad Lek. 2004;57(5-6):229-32. [PubMed]
- Jenkinson C, Stradling J, Petersen S. Comparison of three measures of quality of life outcome in the evaluation of continuous positive airways pressure therapy for sleep apnoea. J Sleep Res. 1997 Sep;6(3):199-204. [CrossRef] [PubMed]
- Jenkinson C, Stradling J, Petersen S. How should we evaluate health status? A comparison of three methods in patients presenting with obstructive sleep apnoea. Qual Life Res. 1998 Feb;7(2):95-100. [CrossRef] [PubMed]
Cite as: Silva GE, Goodwin JL, Vana KD, Quan SF. Obstructive sleep apnea and quality of life: comparison of the SAQLI, FOSQ, and SF-36 questionnaires. Southwest J Pulm Crit Care. 2016;13(3):137-49. doi: http://dx.doi.org/10.13175/swjpcc082-16 PDF
Lack of Impact of Mild Obstructive Sleep Apnea on Sleepiness, Mood and Quality of Life
Stuart F. Quan, M.D.1,2,6
Rohit Budhiraja, M.D.3
Salma Batool-Anwar, M.D., M.P.H.2
Daniel J. Gottlieb, M.D., M.P.H.1,2,4
Phillip Eichling, M.D., M.P.H.7,8
Sanjay Patel, M.D., M.S.1,2
Wei Shen, M.D.6,9
James K. Walsh, Ph.D.5
Clete A. Kushida, M.D., Ph.D.10
1Division of Sleep Medicine, Harvard Medical School, Boston, MA
2Division of Sleep and Circadian Disorders, Brigham and Women’s Hospital, Boston, MA
3Department of Medicine, Tufts University School of Medicine, Boston, MA
4VA Boston Healthcare System, Boston, MA
S5leep Medicine and Research Center, St. Luke's Hospital, Chesterfield, MO
6Arizona Respiratory Center, University of Arizona, Tucson, AZ
7College of Medicine, University of Arizona, Tucson, AZ
8Comprehensive Sleep Solutions, Tucson, AZ
9Southern Arizona VA Health Care System, Tucson, AZ
10Stanford University Sleep Clinic and Center for Human Sleep Research, Redwood City, CA
Abstract
Background and Objectives: Obstructive sleep apnea (OSA) is associated with sleepiness, depression and reduced quality of life. However, it is unclear whether mild OSA has these negative impacts. Using data from the Apnea Positive Pressure Long-term Efficacy Study (APPLES), this study determined whether participants with mild OSA had greater sleepiness, more depressive symptoms and poorer quality of life in comparison to those without OSA.
Methods: 239 persons evaluated for participation in APPLES with a baseline apnea hypopnea index (AHI) < 15 /hour were assigned to 1 of 2 groups: No OSA (N=40, AHI < 5 /hour) or Mild OSA (N=199, 5 to <15 /hour) based on their screening polysomnogram. Scores on their Epworth Sleepiness Scale (ESS), Stanford Sleepiness Scale (SSS), Hamilton Rating Scale for Depression (HAM-D), Profile of Mood States (POMS) and Sleep Apnea Quality of Life Index (SAQLI) were compared between groups.
Results: There were no significant differences between the No OSA and Mild OSA groups on any of the 5 measures: ESS (No OSA, 9.8 + 3.5 vs Mild OSA, 10.6 + 4.3, p=0.26), SSS,(2.8 + 0.9 vs. 2.9 + 1.0, p=0.52), HAM-D (4.6 + 3.0 vs. 4.9 + 4.7, p=0.27), POMS (33.5 + 22.3 vs. 28.7 + 22.0, p=0.70), SAQLI (4.5 + 0.8 vs. 4.7 + 0.7, p=0.39).
Conclusion: Individuals with mild OSA in this cohort do not have worse sleepiness, mood or quality of life in comparison to those without OSA.
For accompanying editorial click here.
Abbreviations
AHI Apnea Hypopnea Index
APPLES Apnea Long-term Efficacy Study
BMI Body Mass Index
HAM-D Hamilton Rating Scale for Depression
IRB Institutional Review Board
ESS Epworth Sleepiness Scale
OSA Obstructive Sleep Apnea
PSG Polysomnogram
POMS Profile of Mood States
RDI Respiratory Disturbance Index
SAQLI Sleep Apnea Quality of Life Index
SSS Stanford Sleepiness Scale
WAIS Wechsler Adult Intelligence Scale
Introduction
Obstructive sleep apnea (OSA) is an important sleep related breathing disorder with prevalence rates between 3-17% in men and 3-9% in women (1,2). With the rising trend of obesity, it is becoming increasingly more common (2,3). In a number of longitudinal cohort studies, severe OSA is associated with an increased incidence of hypertension, cardiovascular disease and death (4-9). It also is adversely associated with a number of neurocognitive and behavioral outcomes including depression (10), sleepiness (11), and poor quality of life (12).
The most commonly used metric to classify severity of OSA is the apnea-hypopnea index (AHI) which is the number of apnea or hypopnea events per hour of sleep. Persons with an AHI < 5 are not considered to have OSA (13). In contrast, an AHI > 5 and < 15, AHI > 15 and <30, and an AHI > 30 are classified as mild, moderate, and severe respectively (14). It is generally accepted that OSA can negatively impact mood, wakefulness and quality of life. However, it is unclear whether mild OSA can have such effects (10, 11, 15). Epidemiological studies have generally shown that individuals with OSA are sleepier than those without OSA (16). Existing data in persons with mild OSA referred to sleep clinics are either limited primarily to assessments of sleepiness or have conflicting results (12, 17, 18).
The Apnea Positive Pressure Long-term Efficacy Study (APPLES) is a randomized, double-blinded, sham-controlled, multi-center trial of continuous positive airway pressure (CPAP) therapy designed to determine whether CPAP improves neurocognitive function over a 6-month test period (19). The present study is an analysis of the relationship between assessments of mood, sleepiness and quality of life in those without OSA versus mild OSA at the baseline visit (pre-randomization) in those screened for participation in APPLES. Our intent was to determine whether there was any association between mild OSA and these domains.
Methods
Participants and Study Design
The study design, recruitment procedures, and inclusion and exclusion criteria for APPLES have been described extensively (19). The institutional review board (IRB) at each site approved the study protocol. Briefly, APPLES was a multisite study conducted at 5 clinical centers: Stanford University, Stanford, CA; University of Arizona, Tucson, AZ; Providence St. Mary Medical Center, Walla Walla, WA; St. Luke’s Hospital, Chesterfield, MO; and Brigham and Women’s Hospital, Boston, MA. Participants were recruited into the study primarily from patients scheduled into a regular sleep clinic for evaluation of possible OSA, and from local advertising. Recruitment began in November 2003 and was completed in August 2008. Initial enrollment required age > 18 years and clinical symptoms of OSA, as defined by American Academy of Sleep Medicine (AASM) criteria (14). At enrollment, participants underwent a screening diagnostic polysomnogram (PSG) and baseline neurocognitive testing including the standardized assessments described below. Only participants with an apnea hypopnea index (AHI) > 10 events per hour continued to the clinical trial and were randomized subsequently to sham or active CPAP for 6 months as previously reported (19). Excluded were individuals who had 1) prior OSA treatment with CPAP or surgery, 2) household members with current/past CPAP use, 3) a sleepiness-related automobile accident within the year prior to potential enrollment, (4) oxygen saturations < 75% for > 10% of the diagnostic polysomnogram (PSG) total sleep time; or (5) conditions or use of medications that could potentially affect neurocognitive function and/or alertness. For the present analysis, data from both randomized and non randomized participants at the time of the screening polysomnography visit were utilized. In addition to new information, some of the material related to sleepiness reported herein represent reanalysis of data in a different format from what has been published in a previous paper (20).
Polysomnography
Polysomnography was conducted as previously described using signals from a nasal pressure cannula, nasal/oral thermistor, thoracic and abdominal piezo bands, and a pulse oximeter to classify apnea and hypopnea events. An apnea was identified by a > 90% amplitude decrease from baseline of the nasal pressure signal lasting > 10 sec. Hypopneas were scored if there was a > 50%, but < 90% decrease from baseline of the nasal pressure signal, or if there was a clear amplitude reduction of the nasal pressure signal that did not reach the above criterion but it was associated with either an oxygen desaturation > 3% or an arousal, and the event duration was ≥ 10 seconds. Obstructive apneas were identified by persistence of chest or abdominal respiratory effort during flow cessation. Central apneas were noted if no displacement occurred on either the thoracic or abdominal channels. All studies were scored at the central reading center located at Stanford University.
Assessments of Sleepiness
Epworth Sleepiness Scale (ESS): The ESS is a validated self-administered questionnaire that asks an individual to rate his or her probability of falling asleep on a scale of increasing probability from 0 to 3 in 8 different situations (21). The scores for the 8 questions are summed to obtain a single score from 0 to 24 that is indicative of self-reported sleep propensity. The ESS prior to randomization was administered at the time of the clinical evaluation and on the night of the diagnostic PSG. The value at the time of the diagnostic PSG was used, but if not available, then the value at the time of the clinical evaluation was substituted.
Stanford Sleepiness Scale (SSS): The SSS asks a person to rate current moment sleepiness on a scale of one to seven (22). Each numerical rating has an associated descriptor, for example a rating of 1 is described as “feeling active, vital, alert, or wide awake,” while a rating of 7 is described as “no longer fighting sleep, sleep onset soon; having dream-like thoughts.” For APPLES the SSS was administered at 10:00, 12:00, 14:00, and 16:00 on the day following the diagnostic PSG; the variable analyzed was the mean score from these 4 trials.
Assessments of Mood
Profile of Mood States (POMS): The POMS assesses mood by asking respondents how they feel at that moment according to a series of 65 descriptors such as “unhappy, tense or cheerful” (23). Possible responses are not at all, a little, moderately; quite a lot, extremely. Six mood states are used in the POMS: tension, depression, anger, vigor, fatigue, and confusion, which can be combined to form the total POMS mood disturbance score. Higher scores represent more negative mood states. For this analysis, total mood disturbance score was used.
Hamilton Rating Scale for Depression (HAM-D): The HAM-D is a validated 21-item clinician-administered assessment of the severity of depression (24). APPLES used a modified version of this test, the GRID Hamilton Rating Scale for Depression that was developed through a broad-based international consensus process to both simplify and standardize administration and scoring in clinical practice and research (25). In this scale, 17 items (e.g., depressed mood, suicide, work and anhedonia, retardation, agitation, gastrointestinal or general somatic symptoms, hypochondriasis, loss of insight or weight) are scored using either a 3- or 5-point scale based on intensity and frequency, and are summed to provide a single score. Higher scores reflect more depressive symptoms.
Quality of Life Assessment
Calgary Sleep Apnea Quality of Life Index (SAQLI): The SAQLI was developed as a sleep apnea specific quality of life instrument (26). It is a 35 item instrument that captures the adverse impact of sleep apnea on 4 domains: daily functioning, social interactions, emotional functioning and symptoms. Items are scored on a 7- point scale with “all of the time” and “not at all” being the most extreme responses. Item and domain scores are averaged to yield a composite total score between 1 and 7. Higher scores represent better quality of life.
Statistical Analyses
For this analysis, participants who had an AHI < 5 were assigned to the No OSA group, and those who had an AHI > 5, but < 15 were assigned to the Mild OSA group. Body mass index (BMI) was computed as weight (kg)/height (m)2. Participants’ race/ethnicity were classified as self-reported white or non-white. Marital status was categorized as married or not married. For continuous variables, unadjusted comparisons between the No OSA and Mild OSA groups were made using Student’s t-test. Differences in proportions were assessed using the χ2 test. Analysis of covariance was performed to adjust for differences in study site, age and BMI. Data are expressed as mean + standard deviation (SD) or percentages. P < 0.05 was considered statistically significant. Analyses were performed using IBM SPSS Statistics Version 20 (Chicago, IL).
Results
In Table 1 are shown the demographic data for the No OSA and Mild OSA groups.
Table 1: Demographic Information

The groups were comparable with respect to gender, race, educational achievement, marital status and intelligence. By definition, the AHI for the Mild OSA group was significantly higher than for the No OSA group (10.9 + 2.5 vs. 3.1 + 1.4, p<0.01). However, participants in the No OSA were slightly younger than those in the Mild OSA group (42.1 + 15.1 vs. 47.1 + 13.1 years, p=0.03). There also was a slight trend for those in the Mild OSA group to have a higher BMI (27.3 + 4.5 vs. 29.0 + 5.9 kg/m2, p=0.11). Some differences related to study site were noted as well. For the HAM-D, there was a trend for the mean score of both groups combined to be higher at the Brigham and Women’s Hospital site [N=51] in comparison to the University of Arizona site [N=59] (6.1 + 5.3 vs. 3.6 + 3.6, p=0.046). Similarly, there was a trend for the ESS to be lower at the University of Arizona site [N=61] comparison to the St. Luke’s Hospital Site [N=29] (9.2 + 33 vs. 11.1 + 3.3, p=0.051).
Table 2 shows the comparisons between the No OSA and Mild OSA groups for the sleepiness, mood and quality of life metrics.
Table 2: Sleepiness, Mood and Quality of Life in No OSA and OSA Groups

There were no statistically significant differences observed for any of these variables. The table also shows the power in this study to detect clinically significant differences in these metrics. As shown, there is 90% power to demonstrate a 1.92, 0.52, 12.72, 1.90 and 0.45 difference between groups in the ESS, SSS, POMS, HAM-D and SAQLI respectively. Furthermore, although the No OSA group was slightly younger, there were no significant correlations between age and the ESS, SSS, POMS, HAM-D, and the SAQLI (r values between 0.04 and 0.11).
Discussion
In this analysis, we show that using a commonly accepted definition of mild OSA, sleepiness and mood are not different in comparison to persons without significant OSA. Furthermore, there was no evidence that mild OSA negatively impacts quality of life. These data suggest that mild OSA as currently defined has little adverse impact on sleepiness, mood and quality of life.
We observed that there were no differences in the ESS between participants with No OSA in comparison to those with Mild OSA. Results from other large cohorts are conflicting. Our results are consistent with those of Lopes et al (12) who also did not find that the ESS was elevated in those with Mild OSA in a large population of patients undergoing PSG for suspected OSA. In contrast, a cohort of Chinese patients with mild OSA had a greater prevalence of subjective daytime sleepiness in comparison to those with primary snoring (18). However, the ESS was not higher in contrast to the Sleep Heart Health Study in which the ESS appeared to be greater in those with Mild OSA (16). Similarly, excessive daytime sleepiness was more commonly reported among a cohort of Japanese women participating in a cardiovascular risk study (17). In this latter study, OSA status was determined using pulse oximetry and not PSG. A number of other studies also have reported sleepiness data in subjects with mild OSA. However, small sample sizes, populations with specialized characteristics, and lack of specific comparisons between persons with mild OSA and no OSA limit their interpretability (27-32).
In this study, mood as assessed by the POMS and the HAM-D was not worse in the Mild OSA group. Although depressive symptoms and use of anti-depressants are commonly noted among patients with OSA (33-35), studies of whether mood is affected by mild OSA are few. In 2 studies performed in patients seen in an otolaryngology clinic (27, 31), the Beck's Depression Inventory (BDI) was not different in comparison to either a control group or primary snorers. Similarly, in a group of elderly Koreans referred to a sleep clinic, the BDI was not elevated in comparison to an age-matched control group (36). Our findings extend these previous reports by showing that using two different assessments of mood, there was no adverse impact of mild OSA.
Quality of life in this study was not affected by mild OSA. In contrast, in a number of studies, quality of life assessed with various instruments is impaired in persons with OSA (37-40). However, there are few studies in which the potential impact of mild OSA has been examined. In a relatively small study performed in patients from an otolaryngology clinic, scores on the SAQLI in patients with mild OSA were the same as a group of primary snorers (31). Similarly, in an analysis of 461 elderly women who underwent PSG in the Study of Osteoporotic Fractures cohort, scores on the Functional Outcomes of Sleep Questionnaire were the same across tertiles of OSA severity (41). Thus, our findings demonstrating a lack of association between mild OSA and quality of life are consistent with these previous studies.
Our failure to demonstrate an association between mild OSA and sleepiness, mood and quality of life provides additional data challenging the commonly used threshold for “defining disease” in the assessment of OSA. The traditional cutpoint of 5 originated more than 30 years ago when only apneic events were scored (42, 43). In the intervening years, it has been accepted that hypopneas have pathophysiologic significance and are now incorporated into the AHI (44). Additionally, some clinicians advocate including the more subtle respiratory effort related arousals into a broader respiratory disturbance index (RDI) (45). The data in this study suggest that at least for some domains of OSA symptomatology, mild OSA based on the application of current scoring criteria to older thresholds may in fact be part of a normal population.
Despite our findings, clinicians, insurers and policy makers should be cautioned about using the AHI as the sole metric in determining whether or not to treat an individual patient. The impact of OSA insofar as behavioral and neurocognitive domains are concerned appears to be quite heterogeneous. For example, 54% of individuals in the Sleep Heart Health Study with moderate to severe OSA were not sleepy on any one of 3 measures of sleepiness. Conversely, some individuals with less severe OSA may be sleepy (16). In our study, the mean ESS in both the No OSA and Mild OSA groups was above what would be expected for an unselected general population suggesting that other causes of sleepiness were present in the cohort (16). Thus, before deciding to initiate OSA specific treatment for Mild OSA, clinicians should consider whether there are other explanations for the patient’s symptoms, and not just treat the AHI.
This study does have three major limitations. First, it might be argued that our study was underpowered to detect small differences between the No OSA and Mild OSA groups. However, sufficient statistical power was present to detect clinically important differences (Table 2). For example, it has been proposed that the minimally important difference on repeated administrations of the SAQLI is approximately 1 (46). Our results demonstrated that we had 90% power to detect a change of 0.5. Moreover, our findings are consistent with the limited number of studies previously performed. Second, our participants were a mixture of individuals recruited from sleep clinics and those responding to advertisements. Thus, they may not be representative of the general populace. Third, it is possible that the No OSA group included some individuals who actually had mild OSA. Inasmuch as all participants were considered by clinicians to have symptoms consistent with OSA, some individuals in the No OSA group may have had falsely “negative” PSGs. Such misclassification would bias towards a null effect. The extent to which this occurred is not known, but night to night variability of the AHI is relatively low (47). Thus, we suspect this potential bias is small. Despite these limitations, however, the APPLES cohort was geographically and ethnically diverse, and had a representative gender distribution.
In conclusion, evidence from this analysis does not indicate that mild OSA has any impact on sleepiness, mood or quality of life. This raises concerns whether the current AHI criteria for distinguishing mild OSA from no clinically significant OSA needs to be reassessed. Nevertheless, additional comparisons between individuals who are truly without OSA symptoms and those with mild OSA as currently defined need to be performed before a final conclusion can be determined.
References
- Punjabi NM. The epidemiology of adult obstructive sleep apnea. Proc Am Thorac Soc. 2008;5(2):136-143. [CrossRef] [PubMed]
- Peppard PE, Young T, Barnet JH, Palta M, Hagen EW, Hla KM. Increased prevalence of sleep-disordered breathing in adults. Am J Epidemiol. 2013;177(9):1006-1014. [CrossRef] [PubMed]
- Inge TH, King WC, Jenkins TM, et al. The effect of obesity in adolescence on adult health status. Pediatrics. 2013;132(6):1098-1104. [CrossRef] [PubMed]
- Peppard PE, Young T, Palta M, Skatrud J. Prospective study of the association between sleep-disordered breathing and hypertension. N Engl J Med. 2000;342(19):1378-84. [CrossRef] [PubMed]
- Young T, Finn L, Peppard PE, et al. Sleep disordered breathing and mortality: eighteen-year follow-up of the Wisconsin sleep cohort. Sleep. 2008;31(8):1071-1078. [PubMed]
- Gottlieb DJ, Yenokyan G, Newman AB, et al. Prospective study of obstructive sleep apnea and incident coronary heart disease and heart failure: the sleep heart health study. Circulation. 2010;122(4):352-360. [CrossRef] [PubMed]
- Marshall NS, Wong KK, Liu PY, Cullen SR, Knuiman MW, Grunstein RR. Sleep apnea as an independent risk factor for all-cause mortality: the Busselton Health Study. Sleep. 2008;31(8):1079-1085. [PubMed]
- Punjabi NM, Caffo BS, Goodwin JL, et al. Sleep-disordered breathing and mortality: a prospective cohort study. PLoS Med . 2009;6(8):e1000132. [CrossRef] [PubMed]
- Marin JM, Carrizo SJ, Vicente E, Agusti AG. Long-term cardiovascular outcomes in men with obstructive sleep apnoea-hypopnoea with or without treatment with continuous positive airway pressure: an observational study. Lancet. 2005;365(9464):1046-1053. [CrossRef] [PubMed]
- Schroder CM, O'Hara R. Depression and Obstructive Sleep Apnea (OSA). Ann Gen Psychiatry. 2005;4:13. [PubMed]
- Jordan AS, McSharry DG, Malhotra A. Adult obstructive sleep apnoea. Lancet. 2014;383(9918):736-747. [CrossRef] [PubMed]
- Lopes C, Esteves AM, Bittencourt LRA, Tufik S, Mello MT. Relationship between the quallity of life and the severity of obstructive sleep apnea syndrome. Braz J Med Biol Res. 2008;41(10):908-913. [CrossRef] [PubMed]
- Sateia MJ. International Classification of Sleep Disorders 2nd ed. Westchester, IL: American Academy of Sleep Medicine, 2005; 297.
- American Academy of Sleep Medicine Taskforce. Sleep-Related Breathing Disorders In Adults: Recommendations For Syndrome Definition And Measurement Techniques In Clinical Research. Sleep. 1999;22 (5): 667-689. [PubMed]
- Ayas NT, Hirsch AA, Laher I, et al. New frontiers in obstructive sleep apnoea. Clin Sci (Lond). 2014;127(4):209-216. [CrossRef] [PubMed]c
- Gottlieb DJ, Whitney CW, Bonekat WH, et al. Relation of sleepiness to respiratory disturbance index: the Sleep Heart Health Study. Am J Respir Crit Care Med . 1999;159(2):502-507. [CrossRef] [PubMed]
- Cui R, Tanigawa T, Sakurai S, et al. Associations of sleep-disordered breathing with excessive daytime sleepiness and blood pressure in Japanese women. Hypertens Res. 2008;31(3):501-506. [CrossRef] [PubMed]
- Chen R, Xiong KP, Lian YX, et al. Daytime sleepiness and its determining factors in Chinese obstructive sleep apnea patients. Sleep Breath. 2011;15(1):129-135. [CrossRef] [PubMed]
- Kushida CA, Nichols DA, Quan SF, et al. The Apnea Positive Pressure Long-term Efficacy Study (APPLES): rationale, design, methods, and procedures. J Clin Sleep Med. 2006;2(3):288-300. [PubMed]
- Quan SF, Chan CS, Dement WC, et al. The association between obstructive sleep apnea and neurocognitive performance--the Apnea Positive Pressure Long-term Efficacy Study (APPLES). Sleep. 2011;34(3):303-314B. [PubMed]
- Johns MW. A new method for measuring daytime sleepiness: the Epworth sleepiness scale. Sleep. 1991;14(6):540-545. [PubMed]
- Hoddes E, Dement W, Zarcone V. The development and use of the Stanford Sleepiness Scale (SSS). Psychophysiol. 1972;9:150.
- McNair DM, Lorr M, Droppleman L. Manual for the Profile of Mood States. San Diego, CA: Educational and Industrial Testing Service, 1971;
- Hamilton M. A rating scale for depression. J Neurol Neurosurg Psychiatry. 1960;2356-62.
- Williams JB, Kobak KA, Bech P, et al. The GRID-HAMD: standardization of the Hamilton Depression Rating Scale. Int Clin Psychopharmacol. 2008;23(3):120-129. [CrossRef] [PubMed]
- Flemons WW, Reimer MA. Development of a disease-specific health-related quality of life questionnaire for sleep apnea. Am J Respir Crit Care Med. 1998;158(2):494-503. [CrossRef] [PubMed]
- Ishman SL, Cavey RM, Mettel TL, Gourin CG. Depression, sleepiness, and disease severity in patients with obstructive sleep apnea. Laryngoscope. 2010;120(11):2331-2335. [CrossRef] [PubMed]
- Minoguchi K, Yokoe T, Tazaki T, et al. Silent brain infarction and platelet activation in obstructive sleep apnea. Am J Respir Crit Care Med. 2007;175(6):612-617. [CrossRef] [PubMed]
- Yoshino A, Higuchi M, Kawana F, et al. Risk factors for traffic accidents in patients with obstructive sleep apnea syndrome. Sleep Biol Rhythms. 2006;4144-152.
- Back L, Palomaki M, Piilonen A, Ylikoski J. Sleep-disordered breathing: radiofrequency thermal ablation is a promising new treatment possibility. Laryngoscope. 2001;111(3):464-471. [CrossRef] [PubMed]
- Balsevicius T, Uloza V, Sakalauskas R, Miliauskas S. Peculiarities of clinical profile of snoring and mild to moderate obstructive sleep apnea-hypopnea syndrome patients. Sleep Breath. 2012;16(3):835-843. [CrossRef] [PubMed]
- Lecube A, Sampol G, Lloberes P, et al. Asymptomatic sleep-disordered breathing in premenopausal women awaiting bariatric surgery. Obes Surg. 2010;20(4):454-461. [CrossRef] [PubMed]
- Saunamaki T, Jehkonen M. Depression and anxiety in obstructive sleep apnea syndrome: a review. Acta Neurol Scand. 2007;116(5):277-288. [CrossRef] [PubMed]
- Ohayon MM. The effects of breathing-related sleep disorders on mood disturbances in the general population. J Clin Psychiatry. 2003;64(10):1195-200; quiz, 1274-6. [CrossRef] [PubMed]
- Chandra RK, Epstein VA, Fishman AJ. Prevalence of depression and antidepressant use in an otolaryngology patient population. Otolaryngol Head Neck Surg. 2009;141(1):136-138. [CrossRef] [PubMed]
- Ju G, Yoon IY, Lee SD, Kim TH, Choe JY, Kim KW. Effects of sleep apnea syndrome on delayed memory and executive function in elderly adults. J Am Geriatr Soc. 2012;60(6):1099-1103. [CrossRef] [PubMed]
- Baldwin CM, Ervin AM, Mays MZ, et al. Sleep disturbances, quality of life, and ethnicity: the Sleep Heart Health Study. J Clin Sleep Med. 2010;6(2):176-183. [PubMed]
- Baldwin CM, Griffith KA, Nieto FJ, O'Connor GT, Walsleben JA, Redline S. The association of sleep-disordered breathing and sleep symptoms with quality of life in the Sleep Heart Health Study. Sleep. 2001;24(1):96-105.[PubMed]
- Isidoro SI, Salvaggio A, Bue AL, Romano S, Marrone O, Insalaco G. Quality of life in patients at first time visit for sleep disorders of breathing at a sleep centre. Health Qual Life Outcomes. 2013;11207.
- Stepnowsky C, Johnson S, Dimsdale J, Ancoli-Israel S. Sleep apnea and health-related quality of life in African-American elderly. Ann Behav Med. 2000;22(2):116-120. [CrossRef] [PubMed]
- Kezirian EJ, Harrison SL, Ancoli-Israel S, et al. Behavioral correlates of sleep-disordered breathing in older women. Sleep. 2007;30(9):1181-1188. [PubMed]
- Guilleminault C. Sleep and Breathing. In: Sleeping and Waking Disorders: Indications and Techiniques. Guilleminault C, ed. Menlo Park, CA: Addison-Wesley, 1982; 155-182
- Block AJ, Boysen PG, Wynne JW, Hunt LA. Sleep apnea, hypopnea and oxygen desaturation in normal subjects. N Engl J Med. 1979;300 (10):513-517. [CrossRef] [PubMed]
- Gould GA, Whyte KF, Rhind GB, et al. The sleep hypopnea syndrome. Am Rev Respir Dis .1988;137(4):895-898. [CrossRef] [PubMed]
- Pepin JL, Guillot M, Tamisier R, Levy P. The upper airway resistance syndrome. Respiration. 2012;83(6):559-566. [CrossRef] [PubMed]
- Flemons WW, Reimer MA. Measurement properties of the calgary sleep apnea quality of life index. Am J Respir Crit Care Med. 2002;165(2):159-164. [CrossRef]
- Quan SF, Griswold ME, Iber C, et al. Short-term variability of respiration and sleep during unattended nonlaboratory polysomnography--the Sleep Heart Health Study. Sleep. 2002;25(8):843-849. [PubMed]
Acknowledgements
APPLES was funded by contract 5UO1-HL-068060 from the National Heart, Lung and Blood Institute. The APPLES pilot studies were supported by grants from the American Academy of Sleep Medicine and the Sleep Medicine Education and Research Foundation to Stanford University and by the National Institute of Neurological Disorders and Stroke (N44-NS-002394) to SAM Technology. In addition, APPLES investigators gratefully recognize the vital input and support of Dr. Sylvan Green who died before the results of this trial were analyzed, but was instrumental in its design and conduct.
Administrative Core
Clete A. Kushida, MD, PhD; Deborah A. Nichols, MS; Eileen B. Leary, BA, RPSGT; Pamela R. Hyde, MA; Tyson H. Holmes, PhD; Daniel A. Bloch, PhD; William C. Dement, MD, PhD
Data Coordinating Center
Daniel A. Bloch, PhD; Tyson H. Holmes, PhD; Deborah A. Nichols, MS; Rik Jadrnicek, Microflow, Ric Miller, Microflow Usman Aijaz, MS; Aamir Farooq, PhD; Darryl Thomander, PhD; Chia-Yu Cardell, RPSGT; Emily Kees, Michael E. Sorel, MPH; Oscar Carrillo, RPSGT; Tami Crabtree, MS; Booil Jo, PhD; Ray Balise, PhD; Tracy Kuo, PhD
Clinical Coordinating Center
Clete A. Kushida, MD, PhD, William C. Dement, MD, PhD, Pamela R. Hyde, MA, Rhonda M. Wong, BA, Pete Silva, Max Hirshkowitz, PhD, Alan Gevins, DSc, Gary Kay, PhD, Linda K. McEvoy, PhD, Cynthia S. Chan, BS, Sylvan Green, MD
Clinical Centers
Stanford University
Christian Guilleminault, MD; Eileen B. Leary, BA, RPSGT; David Claman, MD; Stephen Brooks, MD; Julianne Blythe, PA-C, RPSGT; Jennifer Blair, BA; Pam Simi, Ronelle Broussard, BA; Emily Greenberg, MPH; Bethany Franklin, MS; Amirah Khouzam, MA; Sanjana Behari Black, BS, RPSGT; Viola Arias, RPSGT; Romelyn Delos Santos, BS; Tara Tanaka, PhD
University of Arizona
Stuart F. Quan, MD; James L. Goodwin, PhD; Wei Shen, MD; Phillip Eichling, MD; Rohit Budhiraja, MD; Charles Wynstra, MBA; Cathy Ward, Colleen Dunn, BS; Terry Smith, BS; Dane Holderman, Michael Robinson, BS; Osmara Molina, BS; Aaron Ostrovsky, Jesus Wences, Sean Priefert, Julia Rogers, BS; Megan Ruiter, BS; Leslie Crosby, BS, RN
St. Mary Medical Center
Richard D. Simon Jr., MD; Kevin Hurlburt, RPSGT; Michael Bernstein, MD; Timothy Davidson, MD; Jeannine Orock-Takele, RPSGT; Shelly Rubin, MA; Phillip Smith, RPSGT; Erica Roth, RPSGT; Julie Flaa, RPSGT; Jennifer Blair, BA; Jennifer Schwartz, BA; Anna Simon, BA; Amber Randall, BA
St. Luke’s Hospital
James K. Walsh, PhD, Paula K. Schweitzer, PhD, Anup Katyal, MD, Rhody Eisenstein, MD, Stephen Feren, MD, Nancy Cline, Dena Robertson, RN, Sheri Compton, RN, Susan Greene, Kara Griffin, MS, Janine Hall, PhD
Brigham and Women’s Hospital
Daniel J. Gottlieb, MD, MPH, David P. White, MD, Denise Clarke, BSc, RPSGT, Kevin Moore, BA, Grace Brown, BA, Paige Hardy, MS, Kerry Eudy, PhD, Lawrence Epstein, MD, Sanjay Patel, MD
*Sleep HealthCenterscfor the use of their clinical facilities to conduct this research
Consultant Teams
Methodology Team: Daniel A. Bloch, PhD, Sylvan Green, MD, Tyson H. Holmes, PhD, Maurice M. Ohayon, MD, DSc, David White, MD, Terry Young, PhD
Sleep-Disordered Breathing Protocol Team: Christian Guilleminault, MD, Stuart Quan, MD, David White, MD
EEG/Neurocognitive Function Team: Jed Black, MD, Alan Gevins, DSc, Max Hirshkowitz, PhD, Gary Kay, PhD, Tracy Kuo, PhD
Mood and Sleepiness Assessment Team: Ruth Benca, MD, PhD, William C. Dement, MD, PhD, Karl Doghramji, MD, Tracy Kuo, PhD, James K. Walsh, PhD
Quality of Life Assessment Team: W. Ward Flemons, MD, Robert M. Kaplan, PhD
APPLES Secondary Analysis-Neurocognitive (ASA-NC) Team: Dean Beebe, PhD, Robert Heaton, PhD, Joel Kramer, PsyD, Ronald Lazar, PhD, David Loewenstein, PhD, Frederick Schmitt, PhD
National Heart, Lung, and Blood Institute (NHLBI)
Michael J. Twery, PhD, Gail G. Weinmann, MD, Colin O. Wu, PhD
Data and Safety Monitoring Board (DSMB)
Seven year term: Richard J. Martin, MD (Chair), David F. Dinges, PhD, Charles F. Emery, PhD, Susan M. Harding MD, John M. Lachin, ScD, Phyllis C. Zee, MD, PhD
Other term: Xihong Lin, PhD (2 yrs), Thomas H. Murray, PhD (1 yr).
None of the authors claim any conflicts of interest relevant to the article.
Reference as: Quan SF, Budhiraja R, Batool-Anwar S, Gottlieb DJ, Eichling P, Patel S, Shen W, Walsh JK, Kushida CA. Lack of impact of mild obstructive sleep apnea on sleepiness, mood and quality of life. Southwest J Pulm Crit Care. 2014;9(1):44-56. doi: http://dx.doi.org/10.13175/swjpcc082-14 PDF
Sleep Board Review Question: Insomnia in Obstructive Sleep Apnea
Rohit Budhiraja, MD
Department of Medicine, Southern Arizona Veterans Affairs Health Care System (SAVAHCS) and University of Arizona, Tucson, AZ.
What is the estimated prevalence of insomnia symptoms in patients with obstructive sleep apnea?
Reference as: Budhiraja R. Sleep board review question: insomnia in obstructive sleep apnea. Southwest J Pulm Crit Care. 2013;7(5):302-3. doi: http://dx.doi.org/10.13175/swjpcc150-13 PDF
Long-Term Neurophysiologic Impact of Childhood Sleep Disordered Breathing on Neurocognitive Performance
Stuart F. Quan, M.D.ab
Kristen Archbold, Ph.D.c
Alan S. Gevins, D.Sc.d
James L. Goodwin, Ph.D.a
aArizona Respiratory Center, University of Arizona College of Medicine, Tucson, AZ, bDivision of Sleep Medicine, Harvard Medical School, Boston, MA, cPractice Division, University of Arizona College of Nursing, Tucson, AZ, dSAM Technology & San Francisco Brain Research Institute, San Francisco, CA
Abstract
Study Objective. To determine the impact of sleep disordered breathing (SDB) in children on neurocognitive function 5 years later.
Design, Setting, and Participants. A subgroup of 43 children from the Tucson Children’s Assessment of Sleep Apnea Study (TuCASA) who had SDB (RDI > 6 events/hour) at their initial exam (ages 6-11 years) were matched on the basis of age (within 1 year), gender and ethnicity (Anglo/Hispanic) to 43 children without SDB (Control, RDI < 4 events/hour). The Sustained Working Memory Task (SWMT) which combines tests of working memory (1-Back Task), reaction time (Simple Reaction Time) and attention (Multiplexing Task) with concurrent electroencephalographic monitoring was administered approximately 5 years later.
Results. There were no differences in performance on the working memory, reaction time and attention tests between the SDB and Control groups. However, the SDB group exhibited lower P300 evoked potential amplitudes during the Simple Reaction Time and Multiplexing Tasks. Additionally, peak alpha power during the Multiplexing Task was lower in the SDB Group with a similar trend in the Simple Reaction Time Task (p=0.08).
Conclusions. SDB in children may cause subtle long-term changes in executive function that are not detectable with conventional neurocognitive testing and are only evident during neuroelectrophysiologic monitoring.
Introduction
There is increasing evidence that childhood sleep disordered breathing (SDB) is associated with neurobehavioral morbidity (1-3). In cross-sectional studies, children with SDB are found to have deficits in a variety of neurobehavioral domains including attention, executive function, behavior regulation, alertness, learning and academic performance (3). Treatment of OSA with either tonsillectomy or adenoidectomy often results in resolution or improvement in many of these domains (4, 5).
Despite the large amount of data implicating SDB as a causative factor in producing deficits in neurocognition in children, there have been few studies implicating SDB in children as a risk for long-term neurobehavioral morbidity. Several studies have reported that snoring as a surrogate for SDB predicted increased risk for hyperactive behavior (6-8). In addition, in a retrospective analysis, Gozal and Pope (9) reported that low performing middle school students had a greater likelihood of snoring during childhood than their high performing classmates. However, there have been no studies of long-term neurobehavioral morbidity that have used polysomnography (PSG) to document the presence of SDB. Determining whether long-term or permanent deficits in neurocognition occur as a result of SDB will be important in timing of treatment intervention in these children.
In the present study, a subset of the Tucson Children's Assessment of Sleep Apnea Study (TuCASA) underwent additional cognitive neurophysiological testing to determine whether SDB documented during childhood was a risk factor for deficits 5 years later. We hypothesized that children with SDB would exhibit subtle abnormalities during these neurophysiologic tests.
Materials & Methods
Subjects. The Tucson Children’s Assessment of Sleep Apnea study (TuCASA) was a longitudinal cohort established to investigate the correlates and natural history of childhood sleep disordered breathing. Recruitment and overall study methods have been previously described (10, 11). In brief, the TuCASA cohort consisted of healthy school-aged children that were enrolled in a large urban school district in the Southwest United States. With the cooperation of their respective elementary schools, parents of the students were asked to complete a brief screening questionnaire and to provide contact information if they wanted to see if their child was eligible for the study. Those who qualified were then studied using a single overnight unattended in-home PSG along with completion of a questionnaire regarding their sleep habits. TuCASA initially recruited 503 participants (ages 6 – 11) who had their PSGs recorded between the years of 2000 and 2004. Approximately 5 years later, the study attempted to contact the same participants and was successful in restudying 319 children who had valid PSGs for both the baseline and follow-up time points. From this group, we selected 2 groups of children based on their respiratory disturbance index measured from the PSG performed during their baseline exam cycle. No children had received continuous positive airway pressure treatment for SDB. The first group (SDB) consisted of children with SDB as defined by a respiratory disturbance index (RDI) > 6 /hour. The second group (Control) was children without SDB as defined by a RDI < 4/hour. Each child in the Control group was matched to a child in the SDB group on the basis of age (within 1 year), gender and ethnicity. This resulted in a study cohort of 43 pairs of children.
All methods used to recruit subjects and to collect the present data set were approved both by the University of Arizona Human Subjects Committee and the Tucson Unified School District Research Committee. In all cases, we obtained written informed consent from the parents, and assent from the children.
Study Design. Children from both groups were asked to return to the TuCASA sleep laboratory to undergo the Sustained Working Memory Test (SWMT) which was adapted for use in children. The SWMT is an automated cognitive neurophysiological test that combines cognitive test performance measures with electroencephalograhic (EEG) measures. It has been validated in distinguishing cognitive performance in subjects who have ingested alcohol, caffeine, diphenhydramine and who have been sleep deprived (12, 13). These studies were performed on a day separate from any other testing done for TuCASA.
Polysomnography. In both the baseline and follow-up examinations, children underwent unattended, nocturnal home PSG using the Compumedics PS-2 system (Abbotsford, Victoria, Australia) (10, 11). The following signals were obtained: C3/A2 and C4/A1 EEG, right and left electrooculogram, a bipolar submental electromyogram, thoracic and abdominal displacement (inductive plethysmography bands), airflow (nasal/oral thermocouple), nasal pressure, electrocardiogram (single bipolar lead), snoring (microphone attached to a vest), body position (Hg gauge sensor), pulse oximetry (Nonin, Plymouth, MN) and ambient light (sensor attached to the vest to record on/off). Using Compumedics W-Series Replay, v 2.0, release 22, sleep stages were scored according to Rechtschaffen and Kales criteria (14). The RDI was defined as the number of respiratory events (apneas and hypopneas) per hour of the total sleep time irrespective of any associated oxygen desaturation or arousal. Studies with less than 4 hours of scorable oximetry were classified as failed studies and were repeated if the participant consented. Central apneas were scored if both airflow and thoracoabdominal effort were absent. However, central events that occurred after movement were not included. Obstructive apneas were identified if the airflow signal decreased to below 25% of the “baseline amplitude”. Hypopneas were scored if the magnitude of any ventilation signal decreased below approximately 70% of the “baseline” amplitude, as described previously (15).
Body Mass Index Computation. Height and weight were collected on a platform scale. BMI was calculated kg/m2, and percentile of BMI adjusted for age, sex and ethnicity was calculated with a standardized data-analysis program from the Centers for Disease Control (http://www.cdc.gov/nccdphp/dnpao/growthcharts/resources/sas.htm ).
Wechsler Abbreviated Scale of Intelligence (WASI). The WASI (16) is nationally standardized intelligence test which is linked to the Wechsler Intelligence Scale for Children®—Fourth Edition (WISC–IV®). It was administered in TuCASA as part of an overall neurocognitive test battery within several weeks of the SWMT.
Sustained Working Memory Test. The SWMT (17) consists of a brief 25 minute computerized test consisting of two blocks of an attentional multiplexing task, an easy and a more difficult version of a spatial n-back working memory task, and eyes open and eyes closed resting tasks. The test is designed for concurrent EEG recording. Data collected included EEG and evoked potential (EP) signals, as well as task performance measures. All subjects were trained how to perform each task the same day the test was administered.
In the attentional multiplexing task (MT), the participants were required to monitor multiple stimuli as they changed shape, color, and pattern, and to sort each object into a bin based on its relevant features. This task adapted to an individual’s ability level; task difficulty increases if performance exceeds a pre-defined threshold, and decreases if performance falls below the threshold. Each MT block lasted approximately 3.5 minutes. The working memory (WM) test consisted of a 3.5 minute spatial 1-back task, in which participants compared the location of the dot stimulus on each trial to that on the immediately preceding trial. A simple reaction time (SRT) test with the same stimulus and response characteristics also was administered as a control task. Resting EEG was also recorded for 1.5 min with eyes open and 1.5 min with eyes closed.
EEGs were recorded from seven scalp locations (Fz, F3, F4, Cz, Pz, P3, P4) positioned via a nylon electrode cap and referenced to linked mastoids. This montage was designed to include adequate spatial representation of the signal features of primary interest as defined by prior high-resolution EEG studies of the working memory tasks used herein (18). Potentials generated by eye movements and blinks were recorded by electrodes positioned above and at the outer canthus and superior orbital ridge of each eye. The resulting data were digitally high-pass filtered at 0.5 Hz. EEG was recorded continuously during task performance and during passive resting conditions. Electrode impedances were kept < 5 KΩ for the references and <20 KΩ on all other channels.
Automated artifact-detection and artifact-decontamination filters were used to minimize contaminants induced by eye movement and other physiologic and instrumental sources. All data were then visually inspected, and any residual contaminants were excluded from further analysis.
SWMT Data Analysis. To assess neurophysiological measures between the SDB and Control groups, EEG power spectra and EPs were calculated. Power spectra were computed from all artifact-free EEG for each task block and converted to dB power with a log10 transformation. To calculate EPs, trials were averaged in 1.2 s epochs beginning 0.2 s before stimulus onset. EP peak amplitudes were measured relative to the mean amplitude in the prestimulus interval.
A number of prior studies have served to identify spectral features of the EEG that are sensitive to task-difficulty manipulations in the types of working memory tasks used in the SWMT Exam (18-20). Based on such previous findings, a number of such sensitive EEG and EP signals were compared between the SDB and Control groups. EEG alpha power was measured as the maximum power in a 2 Hz band between 8- to 12-Hz in all tasks. Amplitude of the P300 (measured in a 100 ms window centered on the largest positive peak between 250 and 520 ms at Pz), and slow-wave EPs (measured in a 250 ms window centered on the largest positive peak between 250 and 650 ms) were computed in the SRT and 1-back WM tasks. Because of the nature of the MT task, EPs were calculated relative to the onset of the visual feedback that immediately follows a correct or incorrect response. A P300 was measured in the MT as the largest positive peak occurring 200-450 ms after the feedback.
Statistical Methods. Potential differences in the characteristics of the study population between the SDB and Control groups were evaluated using Students’ unpaired t-test or linear correlation. Inasmuch as intelligence is a significant factor in determining performance on neurocognitive tests, analysis of covariance was used to compare performance on the various components of the SWMT between groups while controlling for intelligence as assessed by the WASI. Other covariates were included in the models if significant on univariate analyses. Data were analyzed with IBM SPSS Version 20 (http://www-01.ibm.com/software/analytics/spss/) and are presented as mean + SE.
Results
In Table 1 is shown the characteristics of the children in this study.

Boys and Anglos comprised the majority of the study cohort. No children had undergone an adenotonsillectomy at the time of the 1st PSG, and only 2 had this procedure during the time interval before the 2nd PSG. As defined by the study design, there were no differences between the SDB and Control groups with respect to age, the time of the 1st or 2nd PSG, or at time of SWMT. Additionally, as dictated by the study design, RDI at the 1st PSG was significantly greater in the SDB group as was the BMI and the standardized BMI (sBMI). The RDI at the 2nd PSG also was higher in the SDB group. However, RDI decreased in both groups over the time period from the 1st to the 2nd PSG. Seven children had SDB on both PSGs and 2 children developed SDB over the study interval. In the SDB group, the mean RDI at the 2nd PSG was below the RDI threshold used to define the Control group at the baseline examination (1st PSG). Significant, but weak negative correlations were observed between sBMI and some of the EEG and evoked potential components of the SWMT [1 back peak alpha, r=-.23, p=0.03; Multiplex Block 1 Alpha Power, r=-.25, p=0.02; Multiplex Block 2 Alpha Power, r=-.21, p=0.05; eyes closed peak alpha, r=-.29, p<0.01; eyes open delta theta power, r=-.25, p=0.02]. Overall, the WASI indicated that the cohort was above average in intelligence and there were no differences between the 2 groups. However, there was considerable heterogeneity within the overall cohort (Minimum WASI: 77; Maximum WASI: 138).
The results of various components of the SWMT are shown in Table 2.

Increased slow eye movement, increased delta/theta band power, and decreased eye closed to eyes open alpha power ratio are neurophysiological indicators of decreased alertness. No differences between the SDB and Control groups were observed for any of these alertness measures. Similarly, there were no differences with respect to either % items correct or reaction time for the Simple Reaction Time, 1 Back or Multiplexing Tasks. However, the 1 back slow wave amplitude was lower in the SDB Group, and there was a strong trend for the P300 evoked potential amplitude during the Multiplexing Task (p=0.06) and peak alpha power during the Simple Reaction Time Task (p=0.08) to be lower as well. In addition, peak alpha power during the both blocks of the Multiplexing Task was lower in the SDB Group.
Additional analyses were performed to determine whether performance on the SWMT was related to the presence of SDB at the time of the 2nd PSG. No differences were observed between children who had SDB on the 2nd PSG and those who did not.
Discussion
In this study, we have demonstrated that after approximately 5 years, several conventional measures of executive function were not different between children with and without SDB. However, neuroelectrophysiologic assessments recorded during task performance were able to distinguish between these 2 groups. These data suggest that SDB in children can have a long-term, albeit subtle impact on neurocognition in children.
Two important domains of executive function are attention and working memory. In our study these were assessed using a simple reaction time task, a multiplexing task and a 1 back working memory task. Although we did not observe that children with SDB had worse performance in either of these domains, previous cross-sectional studies in children have found deficits using a variety of instruments (3). However, many of these studies assessed children derived from clinic populations. In addition, none determined if there was any impact on long-term performance.
The principal finding from our study is that peak alpha power during the multiplexing and simple reaction time tasks was lower in the SDB group. Alpha power reduction is generally considered a marker of cortical activation. Thus, during task performance, peak alpha power should decline as a function of the amount of effort needed to accomplish a given task (21). It is possible that SDB children in this study may have expended more effort to maintain task performance, as evidenced by a lower alpha power. Using the SWMT, similar findings have been observed after marijuana smoking (22).
Similar to the differences in peak alpha power between our SDB and Control groups, we also observed that the P300 evoked potential amplitude during the multiplexing task and the slow wave evoked potential amplitudes during the 1 back task were lower in the SDB group. These evoked potential components are thought to represent aspects of memory encoding, manipulation and retrieval (23). Thus, these data suggest that children with SDB may experience subtle long-term impairment in memory function.
There are several possible explanations of why we did not observe any overt deficits in executive function in children with SDB. First, there was a significant improvement in the RDI in the approximately 5 year interval between the 1st PSG and the testing of these children. Thus, in many of the children, remission of their SDB occurred leading to a reduction in any possible impact of SDB on neurocognition. This would support the contention that overt neurocognitive deficits produced by SDB in school-aged children resolve if SDB improves. Second, the cohort overall had above average intelligence. It is plausible that any impact of SDB would be more evident in those who have less cognitive abilities. Third, it is possible that the 1-back working memory task used in the study was not sufficiently difficult to expose any underlying impairments in executive function. Finally, there is the possibility that inherent cognitive reserve is mitigating the impact of SDB. The cognitive reserve theory postulates that individual differences in how the brain processes tasks may prevent greater insult by using preexisting cognitive processes or by recruiting compensatory ones before there is a detrimental impact on performance (24). Inasmuch as children have the potential for a high amount of neural plasticity, this explanation may be highly relevant in children with SDB.
Our study is not without some important limitations. First, classification of these children into Control and SDB groups was done without regards to desaturation during apnea and hypopnea events. Thus, the impact of oxygen desaturation cannot be assessed. It is unlikely, however, that this is a major confounder because significant oxygen desaturation below 90% was uncommonly observed in these children. Second, there may have been misclassification of children into the SDB and Control groups especially at the cutpoint boundary. We believe this is less likely because by setting the Control cutpoint at < 4 events per hour and the SDB cutpoint at > 6 events per hour, there would have been less risk of misclassification. Third, we did not use intelligence as a factor in assigning children to the 2 groups. However, we believe this had little impact on our results because there was no difference between the groups on the WASI, and we controlled for intelligence in the analyses. Finally, we also observed that body mass index was negatively correlated with performance on some of the SWMT components. Others have found that neurocognitive performance may be negatively associated with obesity (25). However, most studies have been cross-sectional and thus the directionality and causal mechanisms of this association are unclear. Nevertheless, it is unlikely that our results can be explained by this association inasmuch as we controlled for BMI in our analyses. Despite these aforementioned limitations, our study is the only one to our knowledge that has simultaneously assessed neuroelectrophysiologic function during performance of executive function testing in children thus demonstrating its feasibility and potential for acquiring unique information.
In conclusion, SDB in children has the potential to result in subtle long-term detrimental effects in executive function that are not detectable with conventional neurocognitive testing, but may be evident with simultaneous neuroelectrophysiologic monitoring. These data emphasize the importance of recognizing and treating SDB in children in order to prevent possible long-term consequences in neurocognitive function.
Acknowledgements
TuCASA was supported by HL62373. In addition, development of the SWMT was supported by grants from the National Institute of Neurological Diseases and Stroke, The National Institute of Mental Health, The Air Force Research Laboratory and The Office of Naval Research.
Conflicts of Interests: The authors do not have any conflicts of interest to disclose.
References
- Owens JA. Neurocognitive and behavioral impact of sleep disordered breathing in children. Pediatr Pulmonol. 2009;44(5):417-422. [CrossRef] [PubMed]
- Grigg-Damberger M, Ralls F. Cognitive dysfunction and obstructive sleep apnea: from cradle to tomb. Curr Opin Pulm Med. 2012;18(6):580-587. [CrossRef] [PubMed]
- Beebe DW. Neurobehavioral morbidity associated with disordered breathing during sleep in children: a comprehensive review. Sleep. 2006;29(9):1115-1134. [PubMed]
- Giordani B, Hodges EK, Guire KE, et al. Changes in neuropsychological and behavioral functioning in children with and without obstructive sleep apnea following Tonsillectomy. J Int Neuropsychol Soc. 2012;18(2):212-222. [CrossRef] [PubMed]
- Ikeda FH, Horta PA, Bruscato WL, Dolci JE. Intellectual and school performance evaluation of children submitted to tonsillectomy and adenotonsillectomy before and after surgery. Braz J Otorhinolaryngol. 2012;78(4):17-23. [PubMed]
- Chervin RD, Ruzicka DL, Archbold KH, Dillon JE. Snoring predicts hyperactivity four years later. Sleep. 2005;28(7):885-890. [PubMed]
- Ali NJ, Pitson D, Stradling JR. Natural history of snoring and related behaviour problems between the ages of 4 and 7 years. Arch Dis Child. 1994;71(1):74-76. [PubMed]
- Urschitz MS, Eitner S, Guenther A, et al. Habitual snoring, intermittent hypoxia, and impaired behavior in primary school children. Pediatrics. 2004;114(4):1041-1048. [CrossRef] [PubMed]
- Gozal D, Pope DW,Jr. Snoring during early childhood and academic performance at ages thirteen to fourteen years. Pediatrics. 2001;107(6):1394-1399. [CrossRef] [PubMed]
- Goodwin JL, Enright PL, Kaemingk KL, et al. Feasibility of using unattended polysomnography in children for research--report of the Tucson Children's Assessment of Sleep Apnea study (TuCASA). Sleep. 2001;24(8):937-944. [PubMed]
- Goodwin JL, Vasquez MM, Silva GE, Quan SF. Incidence and Remission of Sleep-Disordered Breathing and Related Symptoms in 6- to 17-Year Old Children-The Tucson Children's Assessment of Sleep Apnea Study. J Pediatr. 2010; [CrossRef] [PubMed]
- Gevins A, McEvoy LK, Smith ME, et al. Long-term and within-day variability of working memory performance and EEG in individuals. Clin Neurophysiol. 2012;123(7):1291-1299. [CrossRef] [PubMed]
- Smith ME, McEvoy LK, Gevins A. The impact of moderate sleep loss on neurophysiologic signals during working-memory task performance. Sleep. 2002;25(7):784-794. [PubMed]
- Rechtschaffen A, Kales A. A Manual of Standardized Terminology,
- Techniques and Scoring System for Sleep Stages of Human Subject. Washington, D.C.: US Government Printing Office, National Institute of Health Publication, 1968
- Kaemingk KL, Pasvogel AE, Goodwin JL, et al. Learning in children and sleep disordered breathing: findings of the Tucson Children's Assessment of Sleep Apnea (tuCASA) prospective cohort study. J Int Neuropsychol Soc. 2003;9(7):1016-1026. [CrossRef] [PubMed]
- Wechsler D. Wechsler Abbreviated Scale of Intelligence. San Antonio, TX: Psychological Corp., 1999
- Gevins A, Smith ME, McEvoy LK, et al. A cognitive and neurophysiological test of change from an individual's baseline. Clin Neurophysiol. 2011;122(1):114-120. [CrossRef] [PubMed]
- Gevins A, Smith ME, McEvoy L, Yu D. High-resolution EEG mapping of cortical activation related to working memory: effects of task difficulty, type of processing, and practice. Cereb Cortex. 1997;7(4):374-385. [CrossRef] [PubMed]
- Gevins A, Cutillo B. Spatiotemporal dynamics of component processes in human working memory. Electroencephalogr Clin Neurophysiol. 1993;87(3):128-143. [CrossRef] [PubMed]
- McEvoy LK, Smith ME, Gevins A. Dynamic cortical networks of verbal and spatial working memory: effects of memory load and task practice. Cereb Cortex. 1998;8(7):563-574. [CrossRef] [PubMed]
- Gevins A, Smith ME, McEvoy LK. Tracking the cognitive pharmacodynamics of psychoactive substances with combinations of behavioral and neurophysiological measures. Neuropsychopharmacology. 2002;26(1):27-39. [PubMed] [PubMed]
- Hart CL, Ilan AB, Gevins A, et al. Neurophysiological and cognitive effects of smoked marijuana in frequent users. Pharmacol Biochem Behav. 2010;96(3):333-341. [CrossRef] [PubMed]
- Polich J. Updating P300: an integrative theory of P3a and P3b. Clin Neurophysiol. 2007;118(10):2128-2148. [CrossRef] [PubMed]
- Stern Y. Cognitive reserve. Neuropsychologia. 2009;47(10):2015-2028. [CrossRef] [PubMed]
- Liang J, Matheson BE, Kaye WH, Boutelle KN. Neurocognitive correlates of obesity and obesity-related behaviors in children and adolescents. Int J Obes (Lond). 2013 Aug 5. [Epub ahead of print] [CrossRef] [PubMed]
Reference as: Quan SF, Archbold K, Gevins AS, Goodwin JL. Long-term neurophysiologic impact of childhood sleep disordered breathing on neurocognitive performance. Southwest J Pulm Crit Care. 2013;7(3):165-75. doi: http://dx.doi.org/10.13175/swjpcc110-13 PDF
Obstructive Sleep Apnea and Cardiovascular Disease: Back and Forward in Time Over the Last 25 Years
Stuart F. Quan, M.D.
Division of Sleep Medicine, Harvard Medical School and Brigham Womens Hospital, Boston, MA; Arizona Respiratory Center, University of Arizona College of Medicine, Tucson, AZ
Abstract
Over the past 25 years, there have been significant advances made in understanding the pathophysiology and cardiovascular consequences of obstructive sleep apnea (OSA). Substantial evidence now implicates OSA as an independent risk factor for the development of hypertension, coronary artery disease, congestive heart failure and stroke, as well as increased risk of death. Pathophysiologic mechanisms include release of inflammatory mediators, oxidative stress, metabolic dysfunction, hypercoagulability and endothelial dysfunction. Although non-randomized intervention studies suggest that treatment of OSA with continuous positive airway pressure may mitigate its impact of the development of cardiovascular disease, randomized clinical trials are lacking.
Introduction
The first report of the physiologic events occurring in obstructive sleep apnea (OSA) was published in 1965 by Gastaut and colleagues (1). However, literary and historical accounts of what most likely was OSA have existed since antiquity (2). Most well-known of these is the description of Burwell’s case of a man falling asleep while playing poker. This led to the widespread use of the “Pickwickian Syndrome” because of the similarity of the patient’s symptoms to the literary imagery of “Joe, the fat boy”, a character in Charles Dicken’s Posthumous Papers of the Pickwick Club (3). In the 50 years since Gastaut’s original description of OSA, there has been an exponential growth in the recognition that it is a clinical condition with a high prevalence, subtle to disabling clinical symptoms, and more recently, substantial cardiovascular morbidity and mortality. However, much of the progress in our understanding of OSA with respect to cardiovascular disease has occurred in the past 25 years. Thus, it is appropriate to look back to where we were 25 years ago, our current state of knowledge and identify avenues for future research. Before doing so, however, one must examine whether there is sufficient evidence suggest that a biologic association between OSA and cardiovascular disease is plausible.
Obstructive Sleep Apnea and Cardiovascular Disease: Biologic Plausibility
Obstructive sleep apnea is characterized by repetitive episodes of occlusion or near occlusion of the upper airway at the level of the pharynx despite increasing inspiratory efforts (4). These episodes are terminated by brief arousals from sleep resulting in sleep fragmentation. There are a number of physiologic consequences to what essentially are repetitive involuntary Müeller maneuvers (5,6). With cessation or near cessation of airflow, transient oxygen desaturation and hypercarbia occur (4,6). Inspiratory efforts against an occluded airway result in large intrathoracic pressure swings (5,6). As a result, there is increased sympathetic nervous system activity (7), fluctuations in parasympathetic tone (8), large cyclical changes in heart rate, arterial and pulmonary vasoconstriction and hypertension, and increases in cardiac preload and afterload (9-11). Given the chronicity of OSA, it is not difficulty project that such physiologic changes might lead to daytime cardiovascular dysfunction. Indeed, daytime hypertension has been induced in a canine model of OSA (12) as well as in rodent models of intermittent hypoxia (13). Thus, there are potential biologic mechanisms to explain why OSA might be an independent risk factor for cardiovascular disease.
Obstructive Sleep Apnea and Cardiovascular Disease: Circa 1970s-1980s
In the 1980’s, studies in Europe found cross-sectional associations between snoring as a surrogate for OSA and both hypertension and cardiovascular disease (14,15). Slightly earlier, evidence also was emerging of an association between obstructive sleep apnea and hypertension. These studies noted a greater than 50% prevalence of hypertension among patients with OSA (16,17) and conversely, a 20-30% prevalence of OSA was observed in patients with hypertension (18,19). Furthermore, several case control and cohort studies indicated that the risk of stroke or heart disease was 2.1 to 10.3 fold greater for those with snoring (20-23). Cardiac arrhythmias were frequently noted to occur in OSA patients as well (24).
Later during this time period, there were 3 retrospective studies analyzing the relationship between OSA and mortality. From the Henry Ford Sleep Disorders Center, the vital status of 385 male patients with OSA studied with polysomnography between 1978 and 1986 was determined. Mortality was significantly greater in those with an apnea index (not apnea hypopnea index [AHI]) greater than 20 events/hour. Uvulopalatopharyngoplasty did not attenuate the mortality rate, but better survival was reported in those who had a tracheostomy or were prescribed nasal continuous positive airway pressure (CPAP) (25). At the same time, the Stanford Sleep Disorders Center analyzed their experience in 198 patients who had either a tracheostomy (n=71) or were treated conservatively with a recommendation for weight loss (n=127). There were 14 deaths of which 8 were from stroke or myocardial infarction over a 5 year follow-up period. All occurred in the conservatively treated group (26). In contrast, another series from the University of Florida failed to find any mortality differences between 91 treated and untreated OSA patients and 35 patients with symptoms consistent with OSA, but negative findings on polysomnography over a 7-98 month follow-up (27).
Given the known acute effects of repetitive obstruction of the upper airway on systemic and pulmonary blood pressure, and heart rate, as well as the recurrent episodes of hypoxemia (11), linkages between these physiologic findings and the development of cardiovascular disease were proposed (28). One such pathophysiologic pathway highlighted important roles for hypoxemia and increased sympathetic activity, both of which are currently considered important mechanistic factors for the development of cardiovascular disease (28).
Obstructive Sleep Apnea And Cardiovascular Disease 2012: Epidemiology
Starting in the mid 1990’s, important observations were made that solidified linkages between OSA and cardiovascular disease. In the Wisconsin Sleep Cohort, the first large prospective population-based cohort study to use polysomnography to confirm the presence of OSA, Peppard et al. (29) demonstrated that OSA was an independent risk factor for the development of hypertension. Furthermore, the risk progressively increased with greater levels of OSA severity (OR: 1.42, 2.03, 2.89 [AHI: <5, 5-<15, >15 /hour vs. referent=0]) (29). These findings were subsequently confirmed in the Sleep Heart Health Study (OR: 1.13, 1.54, 2.119 [AHI: 5-<15, 15-<30, >30 /hour vs. referent=<5], although they were significantly attenuated when body mass index (BMI) was included in the analytic models (30). In addition, the development of hypertension was found to be associated with the presence of nocturnal hypoxemia. A more recent prospective study from a clinical cohort showed similar findings (31). Moreover, a number of studies have shown that blood pressure will decrease after treatment of OSA with continuous positive airway pressure (32). Although the magnitude of improvement in large clinical trials is only 2-3 mm Hg, such changes are large from an epidemiologic and public health perspective, and may be greater in individual patients and those with resistant hypertension (33). Given this evidence, the Joint National Committee on Prevention, Detection, Evaluation, and Treatment of High Blood Pressure has concluded that OSA is an identifiable cause for the development of hypertension (34).
Evidence now indicates that OSA is an independent risk factor for the development of coronary heart disease (CHD). In a Spanish clinical cohort of only men, there was an increased risk of incident CHD over a 12 year follow-up period (35). Subsequently, this observation was confirmed in the Sleep Heart Health Study (36). In this latter study, however, increased risk (Hazard Ratio: 1.75 for AHI > 30 /hour vs. AHI < 5) was only observed in men less than 70 years of age. It is possible that the absence of an impact of OSA on risk of CHD in older men is related to a “healthy survivor” effect (37). Thus, whether OSA increases the likelihood of developing CHD in older men and women remains unclear.
In addition to findings linking OSA to greater risk of incident CHD, OSA appears to enhance the likelihood of new events in those with prevalent CHD. In a study of 407 consecutive patients with CHD, those with an oxygen desaturation index greater than 5 per hour had a 70% relative increase and a 10.7% absolute increase in the composite endpoint (cerebrovascular event, myocardial infarction or death) (38). In another study, 89 patients who had undergone percutaneous coronary intervention had polysomnography with OSA found in 51. In comparison to those who did not have OSA, 23.5% vs. 5.3% had a major adverse coronary event (cardiac death, reinfarction, and target vessel revascularization) in the ensuing follow-up period (mean=227 days) (39).
Sleep apnea, in particular central sleep apnea, frequently is observed in association with congestive heart failure (CHF). However, recent data from the Sleep Heart Health Study suggest that severe OSA is a risk factor for incident CHF in men (Hazard Ratio: 1.71 for AHI > 30 /hour vs. AHI < 5), but not women (36).
Recent observations indicate that stroke incidence also may be increased in those with OSA. In the Wisconsin Sleep Cohort over a 4 year follow-up, a significantly increased odds ratio for incident stroke after age and sex adjustment of 4.48 was observed in those with an AHI > 20 /hour (40). This was attenuated to 3.08 after controlling for body mass index. In the Sleep Heart Health Study, a significant increase in incident stroke risk also was found in those with an AHI > 20 /hour, but only in men (41).
As initially reported over 25 years ago (24), more recent observations have confirmed an association between OSA and cardiac arrhythmias. In the Sleep Heart Health Study, those with severe OSA were more likely to have both ventricular and atrial ectopy (42). Furthermore, those with severe OSA were 4.5 and 1.8 times more likely to have episodes of atrial fibrillation, and complex ventricular ectopy or non-sustained ventricular tachycardia.42 Additional analyses reveal that the relative risk of having an episodes of atrial fibrillation is 17 times greater after an apnea or hypopnea episode and there is 1 excess episode of paroxysmal atrial fibrillation or nonsustained ventricular tachycardia for every 1000 hours of sleep or 40000 respiratory disturbances (43). Obstructive sleep apnea with attendant hypoxemia also may be a risk factor for recurrence of atrial fibrillation after cardioversion (44).
Finally, there is now relatively conclusive evidence from 3 longitudinal cohort studies demonstrating that OSA contributes to excess mortality. In the Busselton Health Study of 380 individuals followed for a mean of 13.4 years, a respiratory disturbance index of greater than 15 /hour yielded a hazard ratio of 6.24 for excess mortality (45). Subsequently, in an 18 year follow-up of 1496 participants in the Wisconsin Sleep Cohort, the adjusted hazard ratio for excess all cause mortality related to severe OSA was 3.0 in comparison to no OSA (46). Furthermore, the hazard ratio related to cardiovascular disease mortality was 5.2 (46). More recently, the Sleep Heart Health Study reported a hazard ratio of 1.46 for all cause mortality over an 8.2 year average follow-up. Similar to the Wisconsin Sleep Cohort, it appeared that cardiovascular deaths accounted for much of the excess risk (47). In this latter study, indices of nocturnal hypoxemia also were associated with excess all cause mortality. Although sudden cardiac death in the general population usually occurs during the 6 am to 12 noon time frame, in those with OSA, it is shifted to night-time hours, 12 midnight to 6 am providing further evidence of the adverse impact of OSA on the heart (48).
Obstructive Sleep Apnea and Cardiovascular Disease: Mechanistic Observations
Since the initial observations of the physiologic events that might be operative in the pathogenesis of cardiovascular sequelae of OSA over 25 years ago, substantial progress has been made towards understanding how OSA is a risk factor for cardiovascular disease. These findings include OSA induced changes in cardiac structure and function, abnormalities in metabolic function, and increases in inflammation, coagulability and sympathetic nervous system activity. These latter issues then interact to enhance atherogenesis and cardiac dysfunction.
Obstructive sleep apnea is associated with increases in left ventricular mass. In the Sleep Heart Health Study, those with an AHI > 30 /hour in comparison to those with an AHI < 5 were more likely to have left ventricular hypertrophy on echocardiography, and estimates of left ventricular mass were higher (49). These associations were even stronger when indices of nocturnal hypoxemia were used instead of the AHI. This further highlights the potential role of hypoxemia in the pathogenesis of cardiovascular disease attributable to OSA. Given the presence of left ventricular hypertrophy related to OSA, it is not surprising that diastolic dysfunction is more common among individuals with OSA (50). However, use of CPAP may improve left ventricular function (50). This raises the possibility that early intervention to treat OSA may reduce cardiac morbidity and mortality.
A number of studies have demonstrated that OSA is associated with metabolic abnormalities. For example, in the Sleep Heart Health Study, levels of cholesterol and triglycerides increased as a function of increasing OSA severity (51). These findings may be related to OSA induced intermittent hypoxia (52). Furthermore, the prevalence of metabolic syndrome is higher among persons with OSA in comparison to those without OSA (53). This finding appears to be driven primarily by the higher frequency of hypertension in persons with OSA. Whether these findings are causally related to OSA remains to be determined. However, OSA might potentially increase the risk of CHD by promoting dyslipidemia.
The prevalence of OSA among persons with type 2 diabetes mellitus is high with one study observing that 86% of obese type 2 diabetics had an AHI >5 /hour, indicative of mild OSA (54). Therefore, it is not surprising that considerable evidence now implicates OSA as a determinant of glucose regulation. Both cross-sectional and prospective studies have demonstrated that OSA is a risk factor for glucose dysregulation and in some studies incident diabetes mellitus (55). Furthermore, some studies have demonstrated that treatment of OSA with CPAP results in improved glucose control (55). Data suggest that OSA induced hypoxemia may be a causative mechanism (56). The close association between OSA and type 2 diabetes mellitus raises the distinct possibility that a positive interaction exists to increase the risk of CHD in persons with both conditions.
It is generally accepted that obesity is a risk factor for the development of OSA (57). However, a few studies have reported that reverse causality may be present such that OSA promotes weight gain (58,59). Recent data from the Sleep Heart Health Study support this hypothesis. Over an approximate 5 year follow-up, weight gain was greater among those with an AHI > 15 /hour in comparison to those with an AHI < 5 /hour (60). Thus, promotion of weight gain may be another mechanism by which OSA increases cardiovascular risk.
Especially in those with severe OSA, recurring apneas and hypopneas result in repetitive episodes of hypoxia and reoxygenation. This produces oxidative stress leading to an increase in the flux of free radicals, induction of endothelin expression, suppression of nitric oxide generation, local vasoconstriction and changes in vascular permeability (61). All of these effects have the potential of enhancing the development of cardiovascular disease.
Substantial data now is available demonstrating that OSA is associated with release of a number of inflammatory mediators such as IL6, sIL6R, IL-8, TNFα, CRP and NF-Kappa β (62). In addition, there is evidence for elevated levels of pro-thrombotic factors such as PAI-1, P-selectin, fibrinogen and VEGF in persons with OSA (62). With the recent findings of the importance of inflammation and thrombosis in the pathogenesis of cardiovascular disease, these observations may be important causal mechanistic links that lead OSA to cardiovascular disease.
Using observations from 25 years ago in combination with current data, a plausible pathogenic pathway from OSA to cardiovascular can be summarized as follows (Figure 1). Recurrent episodes of apnea and hypopnea lead to intermittent hypoxia, increased sympathetic activity, hypercapnia, sleep fragmentation with arousals and large swings in intrathoracic pressure. These physiologic perturbations result in increased oxidative stress, release of inflammatory mediators, metabolic dysfunction, weight gain, hypercoagulability, glucose dysregulation and endothelial dysfunction All of these mechanisms can lead to the development of hypertension, diabetes mellitus, CHD, CHF, stroke and increased risk of death.

Figure 1. Proposed mechanisms leading from physiologic alterations occurring during obstructive sleep apnea and hypopnea to the development of cardiovascular disease.
Obstructive Sleep Apnea and Cardiovascular Disease: Knowledge Gaps
Although significant advances have been made in our understanding of the relationship between OSA and CVD in the past 25 years, there are a number of important areas which require further investigation. With respect to OSA and hypertension, it remains unclear whether treatment of OSA reduces the risk of developing hypertension. Most studies to date have used non-randomized cohorts. In the most recently published randomized controlled trial, CPAP treatment did not decrease the incidence of hypertension in nonsleepy subjects over a median 4 year follow-up (63). However, post-hoc analyses did suggest an effect in subjects who were compliant with CPAP for more than 4 hours per night (63). Furthermore, if CPAP or other treatments for OSA are beneficial in reducing CVD risk, are there subsets of the population for whom it is more advantageous?
As to the impact of OSA on CVD and stroke, there also have not been any published large scale clinical trials demonstrating an impact of treatment on changing the incidence of disease. Similar to hypertension, published studies are from non-randomized cohorts. However, there are several large clinical trials such as Randomized Intervention with CPAP in Coronary Artery Disease and Sleep Apnoea (RICCADSA), Sleep Apnea Cardiovascular Endpoints Study (SAVE), and Heart Biomarker Evaluation in Apnea Treatment study (HeartBEAT). In the RICCADSA study, 400 CAD participants will be randomized to one of 4 groups: 1) non-sleepy with OSA treated with CPAP, 2) non-sleepy with OSA and no CPAP treatment, 3) sleepy with OSA treated with CPAP, 4) CAD but no OSA. The participants will be followed for 3 years for CVD morbidity and mortality (64). In the multinational SAVE trial, participants with OSA at high risk for CVD will be randomized to CPAP or conventional medical therapy, and followed for 3-5 years (65). Because of the length of follow-up required and expense, and some would argue the ethical dilemmas in performing a long-term interventional trial, studies such as the recently completed HeartBEAT have attempted to assess intermediate outcomes. In the HeartBEAT trial, 270 subjects with CHD or at high risk for CHD were randomized to healthy lifestyle instruction, CPAP or nocturnal oxygen with a primary endpoint of 24 hour blood pressure (66). Whether findings from trials using intermediate endpoints will be predictive of an impact on “hard” endpoints such as incident myocardial infarction or stroke remains to be determined.
Conclusions
Substantial progress has been made in the past 25-30 years in our understanding of the relationship between OSA and CVD. Accumulating evidence implicates OSA as an independent risk factor for hypertension, CHD and stroke. However, the risk may not be the same for all segments of the population. A variety of mechanisms may be operative. Non-randomized trials suggest that treatment appears to mitigate the risk in some clinical populations, but it is unclear whether treatment is beneficial in patients without symptoms. Large scale randomized clinical trials are needed to clearly demonstrate that current treatment modalities for OSA can mitigate CVD risk and to delineate which populations will accrue the most benefit.
References
- Gastaut H, Tassinari CA, Duron B. Polygraphic study of diurnal and nocturnal (hypnic and respiratory) episodal manifestations of Pickwick syndrome. Rev Neurol (Paris) 1965; 112(6):568-579.
- Kryger MH. Sleep apnea. From the needles of Dionysius to continuous positive airway pressure. Arch Intern Med 1983; 143(12):2301-2303.
- Bickelmann AG, Burwell CS, Robin ED, Whaley RD. Extreme obesity associated with alveolar hypoventilation; a Pickwickian syndrome. Am J Med 1956; 21(5):811-818.
- White DP. Sleep apnea. Proc Am Thorac Soc 2006; 3(1):124-128.
- Podszus T, Greenberg H, Scharf SM. Influence of Sleep State and Sleep-Disordered Brathing on Cardiovascular Function. In: Sleep and Breathing. Saunders NA and Sullivan CE, eds. New York, NY: Marcel Dekker, 1994; 257-310
- Schaub CD, Schneider H, O'Donnell CP. Mechanisms of acute and chronic blood pressure elevationin animal models of obstructive sleep apnea. In: Sleep apnea: implications in cardiovascular and cerebrovascular disease. Bradley TD and Floras JS, eds. New York: Dekker, 2000; 554
- Somers VK, Dyken ME, Clary MP, Abboud FM. Sympathetic neural mechanisms in obstructive sleep apnea. J Clin Invest 1995; 96(4):1897-1904.
- Leung RS. Sleep-disordered breathing: autonomic mechanisms and arrhythmias. Prog Cardiovasc Dis 2009; 51(4):324-338.
- Parker JD, Brooks D, Kozar LF, et al. Acute and chronic effects of airway obstruction on canine left ventricular performance. Am J Respir Crit Care Med 1999; 160(6):1888-1896.
- Lorenzo-Filho G, Bradley TD. Cardiac function in sleep apnea. In: Sleep Apnea--Pathogeneis, Diagnosis, and Treatment. Pack AI, ed. New York, NY: Marcel Dekker, 2002; 377-410
- Schroeder JS, Motta J, Guilleminault C. Hemodynamic studies in sleep apnea. In: Sleep Apnea Syndromes. Guilleminault C and Dement WC, eds. New York: Alan R. Liss, 1978; 177-196
- Brooks D, Horner RL, Kozar LF, Render-Teixeira CL, Phillipson EA. Obstructive sleep apnea as a cause of systemic hypertension. Evidence from a canine model. J Clin Invest 1997; 99(1):106-109.
- Bosc LV, Resta T, Walker B, Kanagy NL. Mechanisms of intermittent hypoxia induced hypertension. J Cell Mol Med 2010; 14(1-2):3-17.
- Lugaresi E, Cirignotta F, Coccagna G, Piana C. Some epidemiological data on snoring and cardiocirculatory disturbances. Sleep 1980; 3(3-4):221-224.
- Koskenvuo M, Kaprio J, Partinen M, Langinvainio H, Sarna S, Heikkila K. Snoring as a risk factor for hypertension and angina pectoris. Lancet 1985; 1(8434):893-896.
- Guilleminault C, Tilkian A, Dement WC. The sleep apnea syndromes. Annu Rev Med 1976; 27:465-484.
- Kales A, Cadieux RJ, Bixler EO, et al. Severe obstructive sleep apnea--I: Onset, clinical course, and characteristics. J Chronic Dis 1985; 38(5):419-425.
- Lavie P, Ben-Yosef R, Rubin AE. Prevalence of sleep apnea syndrome among patients with essential hypertension. Am Heart J 1984; 108(2):373-376.
- Fletcher EC, DeBehnke RD, Lovoi MS, Gorin AB. Undiagnosed sleep apnea in patients with essential hypertension. Ann Intern Med 1985; 103(2):190-195.
- Spriggs DA, French JM, Murdy JM, Bates D, James OF. Historical risk factors for stroke: a case control study. Age Ageing 1990; 19(5):280-287.
- Koskenvuo M, Kaprio J, Telakivi T, Partinen M, Heikkila K, Sarna S. Snoring as a risk factor for ischaemic heart disease and stroke in men. Br Med J (Clin Res Ed) 1987; 294(6563):16-19.
- Palomäki H, Partinen M, Juvela S, Kaste M. Snoring as a risk factor for sleep-related brain infarction. Stroke 1989; 20(10):1311-1315.
- Partinen M, Palomaki H. Snoring and cerebral infarction. Lancet 1985; 2(8468):1325-1326.
- Boudoulas H, Schmidt HS, Clark RW, Geleris P, Schaal SF, Lewis RP. Anthropometric characteristics, cardiac abnormalities and adrenergic activity in patients with primary disorders of sleep. J Med 1983; 14(3):223-238.
- He J, Kryger MH, Zorick FJ, Conway W, Roth T. Mortality and apnea index in obstructive sleep apnea. Experience in 385 male patients. Chest 1988; 94(1):9-14.
- Partinen M, Jamieson A, Guilleminault C. Long-term outcome for obstructive sleep apnea syndrome patients. Mortality. Chest 1988; 94(6):1200-1204.
- Gonzalez-Rothi RJ, Foresman GE, Block AJ. Do patients with sleep apnea die in their sleep? Chest 1988; 94(3):531-538.
- Tilkian AG, Guilleminault C, Schroeder JS, Lehrman KL, Simmons FB, Dement WC. Hemodynamics in sleep-induced apnea. Studies during wakefulness and sleep. Ann Intern Med 1976; 85(6):714-719.
- Peppard PE, Young T, Palta M, Skatrud J. Prospective study of the association between sleep-disordered breathing and hypertension. N Engl J Med 2000; 342(19):1378-84.
- O'Connor GT, Caffo B, Newman AB, et al. Prospective study of sleep-disordered breathing and hypertension: the Sleep Heart Health Study. Am J Respir Crit Care Med 2009; 179(12):1159-1164.
- Marin JM, Agusti A, Villar I, et al. Association between treated and untreated obstructive sleep apnea and risk of hypertension. JAMA 2012; 307(20):2169-2176.
- Bazzano LA, Khan Z, Reynolds K, He J. Effect of nocturnal nasal continuous positive airway pressure on blood pressure in obstructive sleep apnea. Hypertension 2007; 50(2):417-423.
- Lozano L, Tovar JL, Sampol G, et al. Continuous positive airway pressure treatment in sleep apnea patients with resistant hypertension: a randomized, controlled trial. J Hypertens 2010; 28(10):2161-2168.
- Chobanian AV, Bakris GL, Black HR, et al. Seventh report of the Joint National Committee on Prevention, Detection, Evaluation, and Treatment of High Blood Pressure. Hypertension 2003; 42(6):1206-1252.
- Marin JM, Carrizo SJ, Vicente E, Agusti AG. Long-term cardiovascular outcomes in men with obstructive sleep apnoea-hypopnoea with or without treatment with continuous positive airway pressure: an observational study. Lancet 2005; 365(9464):1046-1053.
- Gottlieb DJ, Yenokyan G, Newman AB, et al. Prospective study of obstructive sleep apnea and incident coronary heart disease and heart failure: the sleep heart health study. Circulation 2010; 122(4):352-360.
- Murphy TE, Han L, Allore HG, Peduzzi PN, Gill TM, Lin H. Treatment of death in the analysis of longitudinal studies of gerontological outcomes. J Gerontol A Biol Sci Med Sci 2011; 66(1):109-114.
- Mooe T, Franklin KA, Holmstrom K, Rabben T, Wiklund U. Sleep-disordered breathing and coronary artery disease: long-term prognosis. Am J Respir Crit Care Med 2001; 164(10 Pt 1):1910-1913.
- Yumino D, Tsurumi Y, Takagi A, Suzuki K, Kasanuki H. Impact of obstructive sleep apnea on clinical and angiographic outcomes following percutaneous coronary intervention in patients with acute coronary syndrome. Am J Cardiol 2007; 99(1):26-30.
- Arzt M, Young T, Finn L, Skatrud JB, Bradley TD. Association of sleep-disordered breathing and the occurrence of stroke. Am J Respir Crit Care Med 2005; 172(11):1447-1451.
- Redline S, Yenokyan G, Gottlieb DJ, et al. Obstructive Sleep Apnea Hypopnea and Incident Stroke: The Sleep Heart Health Study. Am J Respir Crit Care Med 2010;
- Mehra R, Benjamin EJ, Shahar E, et al. Association of nocturnal arrhythmias with sleep-disordered breathing: The Sleep Heart Health Study. Am J Respir Crit Care Med 2006; 173(8):910-6.
- Monahan K, Storfer-Isser A, Mehra R, et al. Triggering of nocturnal arrhythmias by sleep-disordered breathing events. J Am Coll Cardiol 2009; 54(19):1797-1804.
- Kanagala R, Murali NS, Friedman PA, et al. Obstructive sleep apnea and the recurrence of atrial fibrillation. Circulation 2003; 107(20):2589-2594.
- Marshall NS, Wong KK, Liu PY, Cullen SR, Knuiman MW, Grunstein RR. Sleep apnea as an independent risk factor for all-cause mortality: the Busselton Health Study. Sleep 2008; 31(8):1079-1085.
- Young T, Finn L, Peppard PE, et al. Sleep disordered breathing and mortality: eighteen-year follow-up of the Wisconsin sleep cohort. Sleep 2008; 31(8):1071-1078.
- Punjabi NM, Caffo BS, Goodwin JL, et al. Sleep-disordered breathing and mortality: a prospective cohort study. PLoS Med 2009; 6(8):e1000132.
- Gami AS, Howard DE, Olson EJ, Somers VK. Day-night pattern of sudden death in obstructive sleep apnea. N Engl J Med 2005; 352(12):1206-1214.
- Chami HA, Devereux RB, Gottdiener JS, et al. Left ventricular morphology and systolic function in sleep-disordered breathing: the Sleep Heart Health Study. Circulation 2008; 117(20):2599-2607.
- Arias MA, Garcia-Rio F, Alonso-Fernandez A, Mediano O, Martinez I, Villamor J. Obstructive sleep apnea syndrome affects left ventricular diastolic function: effects of nasal continuous positive airway pressure in men. Circulation 2005; 112(3):375-383.
- Newman AB, Nieto FJ, Guidry U, et al. Relation of sleep-disordered breathing to cardiovascular disease risk factors: the Sleep Heart Health Study. Am J Epidemiol 2001; 154(1):50-59.
- Adedayo AM, Olafiranye O, Smith D, et al. Obstructive sleep apnea and dyslipidemia: evidence and underlying mechanism. Sleep Breath 2012;
- Parish JM, Adam T, Facchiano L. Relationship of metabolic syndrome and obstructive sleep apnea. J Clin Sleep Med 2007; 3(5):467-472.
- Foster GD, Sanders MH, Millman R, et al. Obstructive sleep apnea among obese patients with type 2 diabetes. Diabetes Care 2009; 32(6):1017-1019.
- Clarenbach CF, West SD, Kohler M. Is obstructive sleep apnea a risk factor for diabetes? Discov Med 2011; 12(62):17-24.
- Punjabi NM, Shahar E, Redline S, et al. Sleep-disordered breathing, glucose intolerance, and insulin resistance: the Sleep Heart Health Study. Am J Epidemiol 2004; 160(6):521-530.
- Young T, Peppard PE, Taheri S. Excess weight and sleep-disordered breathing. J Appl Physiol 2005; 99(4):1592-1599.
- Traviss KA, Barr SI, Fleming JA, Ryan CF. Lifestyle-related weight gain in obese men with newly diagnosed obstructive sleep apnea. J Am Diet Assoc 2002; 102(5):703-706.
- Phillips BG, Hisel TM, Kato M, et al. Recent weight gain in patients with newly diagnosed obstructive sleep apnea. J Hypertens 1999; 17(9):1297-1300.
- Brown MA, Goodwin JL, Silva GE, et al. The Impact of Sleep-Disordered Breathing on Body Mass Index (BMI): The Sleep Heart Health Study (SHHS). Southwest J Pulm Crit Care 2011; 3:159-168.
- Prabhakar NR. Oxygen sensing during intermittent hypoxia: cellular and molecular mechanisms. J Appl Physiol 2001; 90(5):1986-1994.
- Kent BD, Ryan S, McNicholas WT. Obstructive sleep apnea and inflammation: relationship to cardiovascular co-morbidity. Respir Physiol Neurobiol 2011; 178(3):475-481.
- Barbe F, Duran-Cantolla J, Sanchez-de-la-Torre M, et al. Effect of continuous positive airway pressure on the incidence of hypertension and cardiovascular events in nonsleepy patients with obstructive sleep apnea: a randomized controlled trial. JAMA 2012; 307(20):2161-2168.
- Peker Y, Glantz H, Thunstrom E, Kallryd A, Herlitz J, Ejdeback J. Rationale and design of the Randomized Intervention with CPAP in Coronary Artery Disease and Sleep Apnoea--RICCADSA trial. Scand Cardiovasc J 2009; 43(1):24-31.
- Anonymous . Continuous Positive Airway Pressure Treatment of Obstructive Sleep Apnea to Prevent Cardiovascular Disease (SAVE). Last Updated: 2011. Accessed: October 1, 2012. http://www.clinicaltrials.gov/ct2/show/NCT00738179.
- Anonymous . Heart Biomarker Evaluation in Apnea Treatment (HeartBEAT). Last Updated: 2011. Accessed: October 1, 2012. http://www.clinicaltrials.gov/ct2/show/NCT01086800.
Contact Information:
Stuart F. Quan, M.D.
Division of Sleep Medicine
Harvard Medical School
401 Park Dr., 2nd Floor East
Boston, MA 02215
Voice: 617-998-8842
Fax: 617-998-8823
Email: Stuart_Quan@hms.harvard.edu
Conflicts of Interest: The author does not have any conflict of interests pertinent to the subject matter of this review.
Reference as: Quan SF. Obstructive sleep apnea and cardiovascular disease: back and forward in time over the last 25 years. Southwest J Pulm Crit Care 2012;5:206-17. PDF