
Sleep
The Southwest Journal of Pulmonary and Critical Care and Sleep publishes articles related to those who treat sleep disorders in sleep medicine from a variety of primary backgrounds, including pulmonology, neurology, psychiatry, psychology, otolaryngology, and dentistry. Manuscripts may be either basic or clinical original investigations or review articles. Potential authors of review articles are encouraged to contact the editors before submission, however, unsolicited review articles will be considered.
July 2023 Sleep Case of the Month: Fighting for a Good Night’s Sleep
Sleep Medicine
Brigham and Women’s Hospital
Harvard Medical School
Boston, MA USA
A 31-year-old man presented for follow-up in the Sleep Medicine clinic. He has a past medical history of a seizure disorder and supraventricular tachycardia (SVT) and was referred after complaining of excessive daytime sleepiness. Current medications include citalopram and diltiazem. Four months prior, he was diagnosed with severe obstructive sleep apnea characterized by an apnea-hypopnea index (AHI) of 34 and an oxygen saturation nadir of 86%. The patient was initiated on continuous positive airway pressure (CPAP) therapy; however, he reported ongoing mask discomfort and difficulty with exhalation while wearing CPAP. Despite partial improvement in sleep fragmentation and daytime sleepiness, the patient reported sleeping for only 4 hours per night. The patient's sleep schedule was irregular, with bedtime ranging between 9:30 pm and 12 am, waking up at 5 am, and taking a daily nap for 4-5 hours in the morning during which he continued to use CPAP. Additionally, he described experiencing episodes of waking up from dreams, often screaming or throwing punches. A score of 15 on the Epworth Sleepiness Scale (ESS) indicated significant daytime sleepiness.
What should be done next? (Click on the correct answer to be directed to the second of five pages)
- Begin oxygen at night
- Begin self-titrating CPAP
- Discontinue diltiazem
- Neurology referral
- Overnight laboratory polysomnography
Associations Between Insomnia and Obstructive Sleep Apnea with Nutritional Intake After Involuntary Job Loss
Salma Batool-Anwar, MD, MPH1
Patricia L. Haynes, MPH2
Aria Panchal3
Stuart F. Quan, MD1,2
1Division of Sleep and Circadian Disorders, Brigham and Women’s Hospital, Harvard Medical School, Boston, MA; 2Mel and Enid Zuckerman College of Public Health, University of Arizona, Tucson, AZ, 3University of Toronto, Canada
Abstract
Objectives: Involuntary job loss is a stressful life event that can result in changes in nutritional intake. Both insomnia and obstructive sleep apnea (OSA) also are associated with alterations in dietary intake, but the extent to which this occurs in those who have experienced involuntary job loss is unclear. This study assessed nutritional intake in recently unemployed persons with insomnia and obstructive sleep apnea in comparison to those without a sleep disorder.
Methods: Participants from the Assessing Daily Activity Patterns through Occupational Transitions (ADAPT) study were screened for sleep disorders using the Duke Structured Interview for Sleep Disorders. They were classified as having OSA, acute or chronic insomnia or no sleep disorder. Dietary data was collected using United States Department of Agriculture Multipass Dietary recall methodology.
Results: A total of 113 participants had evaluable data and were included in this study. The cohort was comprised mainly of women (62%) and 24% were non-Hispanic white. Participants with OSA had a higher BMI compared with no sleep disorder (30.6 ± 9.1 vs 27.4 ± 7.1 kg/m2, p≤0.001). Those with acute insomnia had significantly decreased consumption of total protein (61.5 ± 4.7 vs. 77.9 ± 4.9 g, p≤0.05) and total fat (60.0 ± 4.4 vs. 80.5 ± 4.6 g, p≤0.05). Among the participants with chronic insomnia, there was little overall difference in nutrient consumption compared to the no sleep disorder group although there were several gender specific differences. There were no overall differences between participants with OSA in comparison to no sleep disorder, but women consumed less total fat (89.0 ± 6.7 vs. 57.5 ± 8.0 g, p≤0.01). The Healthy Eating Index of all groups was below the average value of Americans.
Conclusion: Unemployed persons compared to those with sleep disorders differ in their consumption of major nutrients; the dietary composition of those with acute insomnia exhibited the greatest divergence. Additionally, the overall nutritional intake of recently unemployed persons is poor.
Key Words: unemployment, insomnia, obstructive sleep apnea, nutrition, diet
Introduction
Sleep is a vital component of healthy living. According to the National Sleep Foundation and the American Academy of Sleep Medicine, 7-8 hours of regular sleep is essential for maintenance and restoration of metabolic homeostasis and to promote optimal health. Unfortunately increasing numbers of people across the globe suffer from sleep deprivation or sleep disorders (1).
Insomnia and obstructive sleep apnea (OSA) are considered health risks and have been linked with cardiovascular diseases (2), increased risk of accidents (3), loss of productivity, worsening metabolic profiles (4), and even premature mortality (5,6). Certain population subgroups comprising of night shift workers, minorities (racial/ethnic), those with fewer years of education or those belonging to lower socioeconomic class (SES) have been shown to be particularly susceptible to several of these adverse consequences.
A major determinant of SES is employment status. Unemployment can result from involuntary job loss, a stressful and disruptive life event. Moreover, joblessness is associated with insomnia symptoms (7), and we have demonstrated an association between recent job loss and OSA (8).
Both insomnia and OSA are associated with differences in nutritional intake in comparison to non-affected persons. Furthermore, we have demonstrated that the quality of nutritional intake is worse in recently unemployed persons (9). However, the impact of insomnia disorder or OSA on nutritional intake has not been evaluated in this population. The Assessing Daily Activity Patterns through Occupational Transitions (ADAPT) Study (10) is an ongoing longitudinal cohort study of individuals who have suffered involuntary job loss in the last 90 days with data collected on the effects of sleep and sleep disorders on nutritional intake and metabolic outcomes. To better understand the immediate health aftermath of job loss, we analyzed cross sectional data from the baseline assessment of the ADAPT study to assess the associations between two sleep disorders, insomnia disorder and OSA, and nutritional intake.
Methods
Participants
Study participants were part of the ADAPT Study, an 18-month longitudinal study that examined changes in sleep, social rhythms, and obesity following an involuntary job loss (10). The study protocol and recruitment strategy have been described in detail previously. Briefly, all individuals who applied for unemployment insurance (UI) in the greater Tucson, Arizona and surrounding areas between October 2015 and December 2018 received study recruitment flyers within their UI intake packets. Interested individuals contacted study staff and completed phone screens assessing exclusion criteria; potentially eligible individuals were then scheduled for in-person screening visits. Individuals were eligible if they had experienced an involuntary job loss within 90 days of study enrollment, had been with their employer for at least six months, were currently employed less than 5 hours per week and did not complete any night shift work within the last 30 days. During the in-person screening, participants provided written informed consent, as well as information about their demographics, employment and medical history. They also were screened for homelessness, existing physiological and mental health conditions, substance abuse, and major sleep diagnoses which could interfere with social rhythms and sleep patterns. Those who passed screening completed validated mental health and sleep diagnostic interviews.
Data used in this analysis originated from the study’s baseline visit. Of the 446 adults who provided written consent, 191 participants met eligibility criteria and completed a baseline assessment visit, including an at-home data collection period lasting two weeks. Participants were considered for the current analysis if there was an acceptable assessment of sleep and diet on their sleep diaries and dietary recalls respectively for analysis. However, 8 participants were excluded as outliers because their mean energy consumption (MEC) was significantly less than commonly reported norms (11, 12). In addition, data for all variables used in analyses were available for only 113 participants. Descriptive statistics for these participants who constitute the study sample are reported in Table 1.
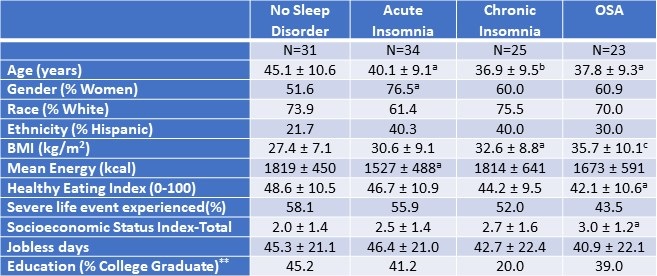
Table 1. Demographic and Anthropometric Characteristics of the Study Population.*
 *Data presented as mean ± SD or percentages as appropriate; ap<0.05; bp<0.01; cp<0.001 vs. No Sleep Disorder; **SES assessed as the sum of 4 component scores; education, Income, Employment, and Housing. Click here to open Table 1 in a separate, enlarged window.
Measures
Demographic and Anthropometric
Age, ethnicity and biological sex were collected during the initial interview. Height and weight were measured using a stadiometer and bioelectrical impedance analyzer via standardized protocols to calculate the body mass index (kg/m2, BMI). Stressful life events were measured using the Life Events and Difficulties Schedule (LEDS -2) (13), a semi-structured interview and consensus panel rating system in which at least three raters provided contextual assessment of threat associated with different life events over the last three months. All raters were trained and required to achieve a kappa of 0.75 with a trained and reliable rater prior to participation in the rating meeting. Life events were considered severe if they conferred a high degree of threat or unpleasantness during both the immediate aftermath of an event and over the next 10 to 14 days. As in our previous (0=less than high school, 1=high school/some college, 2=bachelor’s degree, 4=postgraduate degree), Income (0=less than or equal to 100% of U.S. poverty line, 1=101-200% of poverty line, 2=201-400% of poverty line, 3=greater than 400% of poverty line), Employment (0=unemployed in last 6 months, 1=employed during last 6 months), and Housing (0=not a homeowner, 1=homeowner).
Diet Assessment
During the two-week, at-home baseline data collection period, participants completed up to three 24-hour dietary recalls administered by trained diet assessors at the Behavioral Measurements and Interventions Shared Resource of the University of Arizona Cancer Center utilizing the gold-standard United States Department of Agriculture Multi-pass Dietary recall (15) and the Nutrient Database System of the University of Minnesota for nutrient analysis (16). These interviews were supported by the Remote Food Photography Method (17), in which participants took pictures of all food and beverages prior to consumption, as well as after they had finished eating and drinking. Photos were used to review recall as a final verification of the multi-pass data. The diet recalls provided information on the types and quantity of food, including energy and nutrient values. At least 3 dietary recalls were completed by 172 participants (95.6% of the entire ADAPT cohort).
Sleep Phenotypes
The Duke Structured Interview for Sleep Disorders (DSISD) (18) was used to classify participants into 4 phenotypes: no sleep disorder (Control), obstructive sleep apnea (OSA), acute insomnia disorder and chronic insomnia disorder. The DSISD is a clinical semi-structured interview developed to assess sleep disorder symptoms and was updated to reflect international classification of sleep disorders (ICSD-3) criteria (19). It is divided into 4 modules respectively focused on insomnia disorders, excessive sleepiness conditions, circadian rhythm disorders and parasomnias. During the interview, participants are asked a series of questions related to possible sleep disturbances. Sections of the questionnaire are skipped if the participant endorses negative answers to screening questions. The DSISD has been validated for classifying persons for OSA (20) and insomnia (18). The DSISD was administered by research staff trained in sleep disorder diagnosis, who met reliability levels of 75% with a licensed clinician (PH).
Statistical Analysis
For baseline characteristics, mean (SD) for continuous variables and percentages for categorical variables were calculated. For multivariate models, estimated marginal means are displayed as mean (SD). The participants without any sleep diagnosis were classified as “No Sleep Disorder”. After classifying participants into sleep phenotypes, comparisons of dietary constituents between No Sleep Disorder and OSA, No Sleep Disorder and acute insomnia and No Sleep Disorder and chronic insomnia groups were performed using analysis of covariance. Models were constructed initially without and subsequently with gender stratification. Included covariates were age, BMI, socioeconomic index, presence of a severe life event as measured by the Life Events and Difficulties schedule. The more liberal rating of severity, short term threat vs long term threat, was used for the purpose of this analysis (long term threat rating of at least 2b). The current variable for severe life events was dichotomized (1 = at least one severe event in the last 3 months; 0 = no severe events in the last 3 months). The level of statistical significance for both models was set at 0.05, but comparisons between 0.05 and 0.10 are provided to illustrate a trend. All statistical analyses were done using STATA version 11 (StataCorp, LLC, College Station, TX, USA) or IBM SPSS version 28 (Armonk, NY).
Results
Table 1 demonstrates the demographic and anthropometric characteristics of the study cohort. Both insomnia groups and the OSA group were younger than controls without a sleep disorder. There was a higher proportion of women in all groups (51.6%, 76.5%, 60%, and 60.9% among participants without any sleep disorder, with acute insomnia, with chronic insomnia, and with OSA respectively). Participants with OSA had a higher BMI compared with no sleep disorder (30.6 ± 9.1 vs 27.4 ± 7.1 kg/m2, p ≤ 0.001). Among the No Sleep Disorder group, 45.2% had college education compared with 20.0% among chronic insomnia, 41.2% in acute insomnia, and 39% among participants with OSA. The participants with acute insomnia had significantly less mean energy consumption in comparison to the control group without a sleep disorder (p<0.05). The proportion of participants who had experienced at least one severe life event was not significantly different amongst the groups.
Table 2 displays mean nutritional intakes for acute insomnia in comparison to controls without a sleep diagnosis stratified by gender.
Table 2. Mean Nutritional Intake--Acute Insomnia Compared to No Sleep Disorder Stratified by Gender.
 Data are shown as mean ± standard deviation. Non gender and gender stratified models are adjusted for BMI, severity of stress, socioeconomic status, and age. Mean estimates are evaluated at the following values: BMI = 29.3, severity of stress = .58, socioeconomic status total = 2.25, Age = 42.6 years. Click here to view Table 2 in an enlarged, separate window.
Acute insomnia was characterized by consumption of lower amounts of total protein (61.5 ± 4.7 vs. 77.9 ± 4.9 g, p≤0.05) and total fat (60.0 ± 4.4 vs. 80.5 ± 4.6, p≤0.05). Reductions in total protein were primarily a result of decreased amounts of animal protein. Decreased total fat was accompanied by lower amounts of trans fatty acids and saturated fatty acids. However, these latter results were driven primarily by lower amounts among women (trans fatty acids: 1.3 ± 0.2 vs 2.5 ± 0.3 g, p≤0.05 among women in comparison to 1.9 ± 0.4 vs 1.6 ± 0.3 g, p=NS among men; saturated fatty acids: 19.4 ± 2.3 vs 32.5 ± 2.8 g, p < 0.01 among women in comparison to 25.5 ± 4.2 vs 22.7 ± 2.8 g, p=NS among men). Similarly, those with acute insomnia consumed less cholesterol compared to those without any sleep disorder (357.2 ± 34.6 vs. 241.6 ± 33.4 mg, p≤0.05). In contrast these results were significant only among men (242.5 ± 71.4 mg vs 417 ± 48.2 g, p<0.05 compared to 242.2 ± 38.9 mg vs 299.7 mg ± 47.4, p= NS among women.
Mean nutritional intakes for chronic insomnia are shown in Table 3.
Table 3: Mean Nutritional Intake--Chronic Insomnia Compared to No Sleep Disorder Stratified by Gender.
 Data are shown as mean ± standard deviation. Non gender and gender stratified models are adjusted for BMI, severity of stress, socioeconomic status, and age. Mean estimates are evaluated at the following values: BMI = 29.7, severity of stress = .55, socioeconomic status = 2.29, Age = 41.4 years. Click here to view Table 3 in an enlarged, separate window.
There were no overall differences between chronic insomnia and no sleep disorder with the exception of cholesterol which was lower in chronic insomnia (348.7 ± 32.1 vs. 233.8 ± 36.3 mg, p≤0.05). However, after stratification by gender, men consumed more protein and cholesterol irrespective of sleep phenotype. In addition, there were several interactions; men with chronic insomnia consumed more fatty nutrients and women consumed less. Men with chronic insomnia also had greater intake of vegetable protein. (see Table 3 for numeric detail).
Table 4 provides the mean nutritional intake for participants with OSA in comparison to those with no sleep disorder.
Table 4. Mean Nutritional Intake—Obstructive Sleep Apnea (OSA) Compared to No Sleep Disorder Stratified by Gender.
 Data are shown as mean ± standard deviation. Gender and Non gender stratified models are adjusted for BMI, severity of stress, socioeconomic status, and age. Mean estimates are evaluated at the following values: BMI = 30.96, severity of stress = .52, socioeconomic status total = 2.39, Age = 41.96 years. Click here to view Table 4 in an enlarged, separate window.
Overall, there were few differences between those with OSA and no sleep disorder. However, less cholesterol was consumed by OSA participants than no sleep disorder (351.7 ± 34.9 vs. 222.0 ± 41.0 mg, p≤0.05). Irrespective of sleep phenotype, women consumed less total protein and animal protein in comparison to men. In addition, women with OSA consumed less fatty nutrients (See Table 4 for numeric detail).
Tables 2, 3, and 4 also show the mean energy intake and Healthy Eating Index for no sleep disorder, acute and chronic insomnia and OSA participants. Participants with acute insomnia consumed fewer calories than controls (1508 ± 88 vs. 1836 ± 90, p≤0.05); this finding was principally observed in women. For chronic insomnia and OSA, there were no overall differences in comparison to controls. However, there was an interaction between phenotype and gender such that women with chronic insomnia had the lowest energy intake. In contrast to an ideal Healthy Eating Index of 100 and the value for the average American diet of 58, no sleep disorder and all three sleep phenotypes had lower values.
Discussion
In this paper, we determined the associations among nutrient intake, acute and chronic insomnia and OSA. We found that participants with acute insomnia had decreased intake of proteins and fats. Among participants with chronic insomnia and OSA, there were few overall differences in dietary intake compared with persons with no sleep disorder. However, for both chronic insomnia and OSA, intake of some nutrients was different from no sleep disorder after gender stratification and also between men and women.
There has been increased interest in diet and sleep quality in recent years; previous epidemiologic studies have demonstrated bidirectional associations between diet quality and sleep (21) (22) (23). The results of our study are consistent with the prior research demonstrating an association between dietary content with sleep quality. Increased sleep efficiency in the elderly has been linked with increased intake of tryptophan (24) which is thought to convert to serotonin, a precursor to melatonin, after crossing the blood brain barrier (25). Katagiri et al (22) demonstrated improved sleep quality as measured by Pittsburgh Sleep Quality Index among participants with high intake of fish and vegetables, whereas poor sleep quality was seen in relation to high consumption of confectionary and noodles.
We observed reductions in protein intake among those with acute insomnia. Previous research has suggested an association between sleep and protein intake. A number of neurotransmitters are known to affect sleep-wake cycle namely 5-HT, gamma aminobutyric acid (GABA), orexin, melanin-concentrating hormone, and histamine(26); dietary precursors can influence the synthesis and function of some of these neurotransmitters. Synthesis of 5-HT is dependent on its precursor availability, the amino acid L tryptophan (Trp)(27). Similar to our results, in a cross-sectional study of non-shift workers, researchers demonstrated an association between low protein intake and poor sleep quality particularly with sleep initiation problems. In contradistinction, in another study of middle-aged Japanese, high protein intake was associated with difficulty maintaining sleep (28). Gao et al also confirmed the differential association of individual insomnia symptoms on nutrition. Using the Health Professional Follow up Study (HPFS), the authors demonstrated difficulty maintaining sleep in relation to a greater energy intake along with an association between difficulty initiating sleep and lower overall diet quality score (29). Unlike our findings, the associations in these latter two studies were limited only to men and did not account for employment status. Although it is difficult to extract a definite conclusion from these studies, there appears to be an effect of protein intake on sleep characteristics.
There are several possible mechanisms that have been proposed to explain the association between diet quality and sleep disorders. One mechanism is that increased hunger and decreased satiety signals lead to orexigenic changes of hunger and fullness (30). Epidemiologic studies have demonstrated lower leptin and higher ghrelin levels among sleep deprived people (31, 32). Another explanation described is related to gastrointestinal discomfort from fullness making it difficult to fall or stay asleep (33). Differential impacts of these mechanisms in different study populations likely contribute to the variability in findings among studies.
Although an association between macroeconomic conditions and mortality and morbidity exists (34) (35), there is paucity of literature analyzing the effect of unemployment, dietary habits, and sleep disorders. Consistent with scant previous research, we observed poor diet quality in the face of involuntary job loss (36). The diet quality as assessed by the Healthy Eating Index (HEI) has been found to have an association with multiple chronic diseases outcomes (37). We found lower scores for HEI among women with chronic insomnia. Although we observed lower fat consumption in persons with acute insomnia, a change of macronutrient composition with an increase in high fat, high sugar, and low fruit and vegetable consumption has been described during stressful times (38)
Economic downturn has been linked with less intake of protein, saturated and total fats and more consumption of carbohydrates (36). Unemployment and financial instability have been shown to lead to unhealthy behaviors on one hand but on the other hand more time is available for healthy food preparation (39). To our knowledge, this study is unique as we examined the association between sleep disorders and diet quality in the setting of involuntary job loss.
We do acknowledge that the cross-sectional nature of this study is a limitation; therefore, we cannot determine causality. Another limitation is that the sample was comprised mainly of women and non- Hispanic whites. As previously described, employment opportunities vary by individual characteristics and particularly ethnicity, and therefore the results of this study may not be generalizable to other populations. Furthermore, persons with confirmed diagnoses of sleep disorders were excluded thus potentially limiting the population to those less impacted by any problems with their sleep. Although the DSISD has previously been validated for classifying OSA, we do acknowledge the limitation of using the structured interview as a surrogate for polysomnography.
In conclusion, the dietary intake of recently unemployed persons with insomnia or OSA is different than those without a sleep disorder. This may reflect the impact of an interaction between the effect of recent job loss and the presence of a sleep disorder on dietary habits. Future longitudinal studies of a racially and ethnically diverse population are needed to better understand the directionality/causality.
Acknowledgements
This work was supported by a grant from the National Heart, Lung and Blood Institute (HL117995).
References
- Institute of Medicine Committee on Sleep, M. and Research, The National Academies Collection: Reports funded by National Institutes of Health, in Sleep Disorders and Sleep Deprivation: An Unmet Public Health Problem, H.R. Colten and B.M. Altevogt, Editors. 2006, National Academies Press (US) Copyright © 2006, National Academy of Sciences.: Washington (DC).
- Knutson KL. Sleep duration and cardiometabolic risk: a review of the epidemiologic evidence. Best Pract Res Clin Endocrinol Metab. 2010 Oct;24(5):731-43. [CrossRef] [PubMed]
- Sagaspe P, Taillard J, Bayon V, Lagarde E, Moore N, Boussuge J, Chaumet G, Bioulac B, Philip P. Sleepiness, near-misses and driving accidents among a representative population of French drivers. J Sleep Res. 2010 Dec;19(4):578-84. [CrossRef] [PubMed]
- Gangwisch JE, Malaspina D, Boden-Albala B, Heymsfield SB. Inadequate sleep as a risk factor for obesity: analyses of the NHANES I. Sleep. 2005 Oct;28(10):1289-96. [CrossRef] [PubMed]
- Gallicchio L, Kalesan B. Sleep duration and mortality: a systematic review and meta-analysis. J Sleep Res. 2009 Jun;18(2):148-58. [CrossRef] [PubMed]
- Grandner MA, Hale L, Moore M, Patel NP. Mortality associated with short sleep duration: The evidence, the possible mechanisms, and the future. Sleep Med Rev. 2010 Jun;14(3):191-203. [CrossRef] [PubMed]
- Maeda M, Filomeno R, Kawata Y, Sato T, Maruyama K, Wada H, Ikeda A, Iso H, Tanigawa T. Association between unemployment and insomnia-related symptoms based on the Comprehensive Survey of Living Conditions: a large cross-sectional Japanese population survey. Ind Health. 2019 Nov 29;57(6):701-710. [CrossRef] [PubMed]
- Silva GE, Quan SF, McMorrow T, Bautista R, Bell ML, Haynes PL. Association between obstructive sleep apnea and multiple involuntary job loss history among recently unemployed adults. Sleep Health. 2021 Feb;7(1):118-122. [CrossRef] [PubMed]
- Batool-Anwar S, Mayer C, Haynes PL, Liu Y, Thomson CA, Quan SF. Impact of Recent Job Loss on Sleep, Energy Consumption and Diet. Southwest J Pulm Crit Care. 2021 Aug 1;23(5):129-137.[CrossRef] [PubMed]
- Haynes PL, Silva GE, Howe GW, Thomson CA, Butler EA, Quan SF, Sherrill D, Scanlon M, Rojo-Wissar DM, Gengler DN, Glickenstein DA. Longitudinal assessment of daily activity patterns on weight change after involuntary job loss: the ADAPT study protocol. BMC Public Health. 2017 Oct 10;17(1):793. [CrossRef] [PubMed]
- Vasquez MM, Goodwin JL, Drescher AA, Smith TW, Quan SF. Associations of dietary intake and physical activity with sleep disordered breathing in the Apnea Positive Pressure Long-Term Efficacy Study (APPLES). J Clin Sleep Med. 2008 Oct 15;4(5):411-8. [PubMed]
- Rock CL, Thornquist MD, Kristal AR, Patterson RE, Cooper DA, Neuhouser ML, Neumark-Sztainer D, Cheskin LJ. Demographic, dietary and lifestyle factors differentially explain variability in serum carotenoids and fat-soluble vitamins: baseline results from the sentinel site of the Olestra Post-Marketing Surveillance Study. J Nutr. 1999 Apr;129(4):855-64. [CrossRef] [PubMed]
- Bifulco A, Brown G, Edwards A, Harris T, Neilson E, Richards C, Robinson R. Life events and difficulties schedule (LEDS-2) Vol. 1: Life events manual. London, England: Royal Holloway and Bedford New College, University of London, 1989.
- Singh V, Haynes PL, Quan SF. Assessing Depression and Suicidality Among Recently Unemployed Persons with Obstructive Sleep Apnea and Socioeconomic Inequality. Southwest J Pulm Crit Care Sleep. 2022 May;24(5):81-88. [CrossRef] [PubMed]
- Subar AF, Thompson FE, Potischman N, Forsyth BH, Buday R, Richards D, McNutt S, Hull SG, Guenther PM, Schatzkin A, Baranowski T. Formative research of a quick list for an automated self-administered 24-hour dietary recall. J Am Diet Assoc. 2007 Jun;107(6):1002-7. [CrossRef] [PubMed]
- Feskanich D, Sielaff BH, Chong K, Buzzard IM. Computerized collection and analysis of dietary intake information. Comput Methods Programs Biomed. 1989 Sep;30(1):47-57. [CrossRef] [PubMed]
- Martin CK, Han H, Coulon SM, Allen HR, Champagne CM, Anton SD. A novel method to remotely measure food intake of free-living individuals in real time: the remote food photography method. Br J Nutr. 2009 Feb;101(3):446-56. [CrossRef] [PubMed]
- Edinger J, Wyatt JK. Reliability and validity of insomnia diagnoses derived from the Duke Structured Interview for Sleep Disorders [abstract]. Sleep, 2009. 32: p. A265.
- Buysse DJ, Reynolds CF 3rd, Kupfer DJ, Thorpy MJ, Bixler E, Manfredi R, Kales A, Vgontzas A, Stepanski E, Roth T, et al. Clinical diagnoses in 216 insomnia patients using the International Classification of Sleep Disorders (ICSD), DSM-IV and ICD-10 categories: a report from the APA/NIMH DSM-IV Field Trial. Sleep. 1994 Oct;17(7):630-7. [CrossRef] [PubMed]
- Silva GE, Rojo-Wissar DM, Quan SF, Haynes PL. Predictive ability of the International Classification of Sleep Disorders-3 in identifying risk of obstructive sleep apnea among recently unemployed adults. Sleep Breath. 2021 Sep;25(3):1325-1334. [CrossRef] [PubMed]
- Fenton S, Burrows TL, Skinner JA, Duncan MJ. The influence of sleep health on dietary intake: a systematic review and meta-analysis of intervention studies. J Hum Nutr Diet. 2021 Apr;34(2):273-285. [CrossRef] [PubMed]
- Katagiri R, Asakura K, Kobayashi S, Suga H, Sasaki S. Low intake of vegetables, high intake of confectionary, and unhealthy eating habits are associated with poor sleep quality among middle-aged female Japanese workers. J Occup Health. 2014;56(5):359-68. [CrossRef] [PubMed]
- Hur S, Oh B, Kim H, Kwon O. Associations of Diet Quality and Sleep Quality with Obesity. Nutrients. 2021 Sep 13;13(9):3181. [CrossRef] [PubMed]
- Bravo R, Matito S, Cubero J, Paredes SD, Franco L, Rivero M, Rodríguez AB, Barriga C. Tryptophan-enriched cereal intake improves nocturnal sleep, melatonin, serotonin, and total antioxidant capacity levels and mood in elderly humans. Age (Dordr). 2013 Aug;35(4):1277-85. [CrossRef] [PubMed]
- Duan KM, Ma JH, Wang SY, Huang Z, Zhou Y, Yu H. The role of tryptophan metabolism in postpartum depression. Metab Brain Dis. 2018 Jun;33(3):647-660. [CrossRef] [PubMed]
- Saper CB, Scammell TE, Lu J. Hypothalamic regulation of sleep and circadian rhythms. Nature. 2005 Oct 27;437(7063):1257-63. [CrossRef] [PubMed]
- Silber BY, Schmitt JA. Effects of tryptophan loading on human cognition, mood, and sleep. Neurosci Biobehav Rev. 2010 Mar;34(3):387-407. [CrossRef] [PubMed]
- Tanaka E, Yatsuya H, Uemura M, Murata C, Otsuka R, Toyoshima H, Tamakoshi K, Sasaki S, Kawaguchi L, Aoyama A. Associations of protein, fat, and carbohydrate intakes with insomnia symptoms among middle-aged Japanese workers. J Epidemiol. 2013;23(2):132-8. [CrossRef] [PubMed]
- Cheng FW, Li Y, Winkelman JW, Hu FB, Rimm EB, Gao X. Probable insomnia is associated with future total energy intake and diet quality in men. Am J Clin Nutr. 2016 Aug;104(2):462-9. [CrossRef] [PubMed]
- St-Onge MP. Sleep-obesity relation: underlying mechanisms and consequences for treatment. Obes Rev. 2017 Feb;18 Suppl 1:34-39. [CrossRef] [PubMed]
- Stern JH, Grant AS, Thomson CA, Tinker L, Hale L, Brennan KM, Woods NF, Chen Z. Short sleep duration is associated with decreased serum leptin, increased energy intake and decreased diet quality in postmenopausal women. Obesity (Silver Spring). 2014 May;22(5):E55-61. [CrossRef] [PubMed]
- Taheri S, Lin L, Austin D, Young T, Mignot E. Short sleep duration is associated with reduced leptin, elevated ghrelin, and increased body mass index. PLoS Med. 2004 Dec;1(3):e62. [CrossRef] [PubMed]
- Zuraikat FM, Makarem N, Liao M, St-Onge MP, Aggarwal B. Measures of Poor Sleep Quality Are Associated With Higher Energy Intake and Poor Diet Quality in a Diverse Sample of Women From the Go Red for Women Strategically Focused Research Network. J Am Heart Assoc. 2020 Feb 18;9(4):e014587. [CrossRef] [PubMed]
- Ruhm CJ. Are Recessions Good for Your Health? The Quarterly Journal of Economics. 2000; 115(20):617–650. [CrossRef]
- Ruhm CJ. Recessions, healthy no more? J Health Econ. 2015 Jul;42:17-28. [CrossRef] [PubMed]
- Smed S, Tetens I, Bøker Lund T, Holm L, Ljungdalh Nielsen A. The consequences of unemployment on diet composition and purchase behaviour: a longitudinal study from Denmark. Public Health Nutr. 2018 Feb;21(3):580-592. [CrossRef] [PubMed]
- Morze J, Danielewicz A, Hoffmann G, Schwingshackl L. Diet Quality as Assessed by the Healthy Eating Index, Alternate Healthy Eating Index, Dietary Approaches to Stop Hypertension Score, and Health Outcomes: A Second Update of a Systematic Review and Meta-Analysis of Cohort Studies. J Acad Nutr Diet. 2020 Dec;120(12):1998-2031.e15. [CrossRef] [PubMed]
- Habhab S, Sheldon JP, Loeb RC. The relationship between stress, dietary restraint, and food preferences in women. Appetite. 2009 Apr;52(2):437-44. [CrossRef] [PubMed]
- Burgard SA, Ailshire JA, Kalousova L, The Great Recession and health: People, populations, and disparities. The Annals of the American Academy of Political and Social Science. 2013;650(1):194-213. [CrossRef]
January 2023 Sleep Case of the Month: An Unexpected EEG Abnormality
Ken Cooper, RPSGT2
1Pulmonary Associates
Scottsdale, AZ USA
2Cobre Valley Regional Medical Center
Globe, AZ USA
A 46-year-old woman was referred because of snoring, observed apnea, and daytime hypersomnolence. Her Epworth Sleepiness Scale was 9 out of 24. She was slightly overweight but otherwise her physical examination was normal. An overnight polysomnography was requested but denied by her insurance company.
What should be done at this time? (Click on the correct answer to be directed to the second of six pages)
July 2022 Sleep Case of the Month: A Sleepy Scout
Honolulu, HI USA
History of Present Illness:
A 25-year-old African American man complaining of excessive daytime somnolence. He was a US Army Ranger scout who received a traumatic brain injury (TBI) from an improvised explosive device attack in Afghanistan which resulted in a loss of about ¼ of his visual field. He said he slept well at night and there was no history of snoring. There was no history of any parasomnias.
PMH, SH, FH:
Other than the traumatic brain injury there was no significant PMH. His most recent brain scan showed only the remnants of his brain injury which resulted in an intracerebral hemorrhage which was managed conservatively. He was single. He did not smoke and had only moderate alcohol intake. There was no significant FH of sleep apnea.
Physical Examination:
Other than the visual field loss his physical examination was unremarkable.
What should be done next? (Click on the correct answer to be directed to the second of five pages)
- Brain MRI
- Electroencephalogram (EEG)
- PSG (polysomnography) sleep study
- Repeat CT of head
- All of the above
Assessing Depression and Suicidality Among Recently Unemployed Persons with Obstructive Sleep Apnea and Socioeconomic Inequality
Vijay Singh DO1
Patricia L. Haynes PhD2
Stuart F. Quan MD3,4
1Burrell College of Osteopathic Medicine, Las Cruces, NM
2Department of Health Promotion Sciences, Mel and Enid Zuckerman College of Public Health, University of Arizona, Tucson, AZ
3Division of Sleep and Circadian Disorders, Brigham and Women’s Hospital, Harvard Medical School, Boston, MA
4Asthma and Airway Disease Research Center, University of Arizona, Tucson, AZ
Abstract
Background: Obstructive Sleep Apnea (OSA) is a common sleep-related breathing disorder that often is associated with several psychiatric conditions. Job loss is a stressful life event that can also affect mental health and socioeconomic status (SES). We investigated whether there was an association between the prevalence of OSA and several psychiatric conditions within a cohort of persons who recently became unemployed and whether SES was a contributing factor.
Methods: Data from 292 participants who completed the screening evaluation of the Assessing Daily Activity Patterns through occupational Transitions (ADAPT) Study were used to assess the association between the prevalence of OSA, and current and past depression, and past suicidality. A type III sleep home sleep monitor was used to identify the presence of OSA and assess its severity. Depression and suicidality were ascertained using the Mini-international neuropsychiatric interview. Years of education was used as a proxy for SES.
Results: There were no significant associations between severity of OSA, SES and current depression, past depression, and suicidality. Past suicidality was noted to be more common among those who were single/widowed (17.4%) or those who were divorced or separated (11.1%) (p=0.027). Current depression was more common among Hispanics in comparison to non-Hispanics. Furthermore, prevalence rates of both depression and past suicidality were higher than previous reports in general populations.
Conclusions: Within a cohort of individuals who experienced recent job loss, there was no association between OSA and depression or past suicidality. Prevalence rates of both depression and past suicidality were higher than previous reports in the general population.
Introduction
Obstructive sleep apnea (OSA) is a highly prevalent medical condition characterized by recurrent episodes of partial or complete obstruction of the upper airways during sleep. Common symptoms are loud snoring, witnessed apneas, and daytime fatigue or sleepiness (1). It is associated with various mental health conditions such as depression, anxiety, and post-traumatic stress disorder. Importantly, recent studies with small sample sizes have shown a correlation between suicidal behavior and persons with OSA (2).
Additionally, OSA has also been shown to relate to lower socioeconomic status (SES) which can be impacted by job loss (3). However, the association of OSA, SES with mental health conditions in a population of individuals who have been recently unemployed has not adequately explored.
In this study, we evaluated the association between OSA and SES and a self-reported history of several common psychiatric disorders. We hypothesized that individuals with recent job loss and OSA would have an increased likelihood of having a history of self-reported psychiatric illness and that SES would be contributing factor.
Methods
Study participants were part of the ADAPT Study, an 18-month longitudinal study examining changes in sleep, social rhythms, and obesity following an involuntary job loss. The study protocol and recruitment strategy have been described in detail previously (4). Briefly, all individuals who applied for unemployment insurance (UI) in the greater Tucson, Arizona and surrounding areas between October 2015 and December 2018 received study recruitment flyers within their UI intake packets. Interested individuals contacted study staff and completed phone screens assessing exclusion criteria; potentially eligible individuals were then scheduled for in-person screening visits. Individuals were eligible for overnight screening if they had experienced an involuntary job loss within 90 days of study enrollment, had been with their employer for at least six months, were currently employed less than five hours per week and did not complete any night shift work within the last 30 days. During the in-person screening, participants provided written informed consent, as well as information about their demographics, employment, and medical history. They also were screened for homelessness, existing physiological and mental health conditions, substance abuse, and major sleep diagnoses which could interfere with social rhythms and sleep patterns. An overnight at-home screening for sleep apnea was performed utilizing the ApneaLink PlusTM (ResMed, San Diego, CA) to exclude moderate sleep apnea as a cause of sleep disruption. This study was approved by the University of Arizona Human Subjects Protection Program (#1401185772).
Data used in this analysis originated from the study’s screening visit. Of the 446 adults who provided written consent, 292 adult participants underwent overnight screening for obstructive sleep apnea (OSA) and completed the Mini-international neuropsychiatric interview (5). Participants were classified as having a current or past diagnosis of several mental health disorders including depression, mania, hypomania and suicidality on the basis of their responses to the structured screening interview. The screening survey also recorded information pertaining to socioeconomic status, educational attainment, race, and ethnicity. Severity of OSA was based on the Apnea-Hypopnea Index (AHI) from the home sleep study as follows: No OSA (AHI <5 /h), Mild OSA (AHI ≥5 and <15 /h), Moderate to Severe OSA (AHI ≥15 /h). Primary dichotomous endpoints included percent of people who had past or current episodes of depression, and past episodes of suicidality. Income in relation to the US Health and Human Services Poverty Line for Arizona was used as an indicator of SES based on data from the baseline survey.
Statistical Analysis. Mean and standard deviation for the variables being investigated were used to describe the baseline characteristics of the cohort. Comparison of the prevalence of various mental health conditions as a function of the presence of OSA was performed using a Pearson-Chi Square test. Comparisons of the prevalence of depression and suicidality to previously reported prevalence rates were completed using the binomial test. All statistical analyses were done using IBM SPSS version 28 (Armonk, NY).
Results
Table 1 describes the overall demographic and baseline characteristics for the participants who volunteered to be a part of the survey.
 (Click here to view Table 1 in a separate, enlarged window)
Most participants were White and 35.3% were Hispanic. The majority were women and were not married or had a live-in partner. A majority were living at or below the poverty line and two-thirds had a high school education or less. On average, the population being studied was obese. Moderate to severe OSA was observed in 48 participants (16.4%). Screening for mental health conditions showed that approximately one-third of the cohort had self-reported current as well as past depression. Both current and past depression rates are significantly higher (binomial test, p<0.001) than the 8.1% prevalence of depression reported from the 2013-2016 National Health and Nutrition Examination Survey (NHANES) (6). History of suicidality was present in approximately 11% of the sample. This rate is higher than the 4.2% prevalence of suicidal thoughts in Arizona reported by the National Survey on Drug Use and Health in 2008-2009 (7)(binomial test, p<0.001). The remaining health conditions were observed in very small numbers and were not analyzed further.
Table 2 shows relationships between severity of AHI and marital status, educational attainment, race, and socioeconomic status. No significant associations were observed.
 (Click here to view Table 2 in a separate, enlarged window)
Shown in Table 3 are the associations of severity of OSA, social and demographic characteristics of the participants with current and past episodes of depression.
 (Click here to view Table 3 in a separate, enlarged window)
There were no significant associations with respect to self-reported current or past depression with any demographic characteristics or severity of OSA.
The associations between severity of OSA and demographic characteristics with a history of self-reported past suicidality are shown in Table 4.
 (Click here to view Table 4 in a separate, enlarged window)
Past suicidality was least likely to have occurred among those who were married or had a live-in partner (6.6%) in comparison to those who were single/widowed (17.4%) or those who were divorced or separated (11.1%) (p=0.027). No other significant relationships were found between these demographic factors as well as history of OSA.
Discussion
In this study of recently unemployed adults, we did not find any associations between OSA or SES with the prevalence of self-reported depression (past or current) or past suicidality. However, the prevalence rates for depression were higher in this cohort in comparison to previous reports in the general population particularly among Hispanics. History of suicidality was also higher than reported in the general Arizona population and was observed to be more common among those who were not married or living with a partner.
Although we were unable to find any associations between OSA and psychiatric conditions in our study, most but not all previous literature has found correlations between OSA and patients suffering from depression (8, 9). There are many similarities between OSA and depression including symptoms such as poor sleep, anhedonia, low energy, and lack of concentration (10). It is unclear why our results do not confirm previous findings of a close relationship. However, our cohort had relatively few participants with severe OSA, as compared to samples from sleep centers. It is possible that depressive symptoms are correlated with the AHI only in severe OSA (Lee 2015). Additionally, although most individuals in the study were female who are more likely to have major depression (11), the prevalence of OSA is higher in males (12). Thus, the ability to detect an association between depression and OSA may be low. Furthermore, the prevalence of current (30.2% Male/34.3% Female) and past depression (32.5% Male/42.8% Female) was already high in our cohort of recently unemployed persons in comparison to estimates of the overall prevalence before the COVID-19 pandemic of ~8% (6, 13). Thus, it is possible that any additional impact of OSA would be difficult to detect.
Increased rates of depression have been previously reported among unemployed adults (14). We also found an elevated rate of depression among unemployed persons, but extend these findings to specifically those with recent job loss. Although our depression prevalence rate was higher than previously observed (14), this comparison should be interpreted cautiously given the dissimilarities in ascertainment instruments. It might be surmised that recent job loss is the most plausible explanation for high rates of current depression in this cohort, but it is unclear why the prevalence of past depression also is high. One explanation is that history of depression is a marker for subsequent unemployment as has been previously suggested (15). Irrespective of etiology, our results indicate that recently unemployed persons are at high risk for mental health issues.
Hispanics in our study had higher rates of current depression than non-Hispanics. In a review of depression in Hispanics in the United States, Lewis-Fernandez et al (16) noted that initial studies found that Hispanic populations have higher rates of depression than primarily white populations, but that this was not confirmed in later studies. Hispanics are a heterogenous ethnic group and are primarily of Mexican ancestry in Arizona. In their review, Lewis-Fernandez et al (16) noted that United States-born Mexican Americans had higher rates of depression than those born in Mexico. Although ability to speak English was an inclusion requirement for participation, we could not precisely determine the geographic origin of the Hispanics in this cohort. Thus, the explanation for our finding of higher depression rates in Hispanics remains unclear.
Our study did not find an association between OSA and past suicidality. In contrast, a recent large Danish cohort study of 48,168 patients with OSA found an increased risk of suicide as well as self-harm (17). It is likely that we were underpowered to detect any relationship, since only 33 participants reported past suicide. However, we did find a history of suicidality to be greater in those were single or widowed. This is consistent with previous studies demonstrating suicide rates are higher amongst those who are not married (18). Our data provide additional evidence showing that suicidality is more common among individuals who do not cohabitate.
Similar to our findings related to the prevalence of depression, the past suicidality rate in our cohort was higher than reported in general populations (2, 7, 19). This is most likely related to higher rates of past depression in our cohort.
Lower SES has been associated with a higher occurrence of psychiatric co-morbidities. Patients with lower SES have been noted to have a greater likelihood of developing chronic mental health conditions, particularly depression (20). Studies of OSA and health disparities have demonstrated a higher prevalence of OSA among those who are disadvantaged (21). Although a majority of the cohort had incomes below the poverty line, this status may have been a recent event associated with job loss and therefore not sufficiently impactful to increase the prevalence of OSA.
Our study has several strengths. We assessed a moderate sized cohort consisting of 292 individuals, 126 of which were of the male gender. This allowed us to have a nearly balanced analysis of both male and female genders. Moreover, it is unique in that we explored associations of OSA and mental health among those who were recently unemployed. However, there are some limitations. In particular, our cohort does not reflect the ethnic distribution of the general US population. Approximately one-third of the cohort was Hispanic which is approximately twice the proportion in the US, but nevertheless reflects the ethnic composition of Tucson, AZ. In addition, the relative paucity of persons with severe OSA may have limited our power to detect significant associations.
In conclusion, in this study, we did not find any notable relationships between OSA, SES and depression and past suicidality in those who were recently unemployed although rates of both conditions were higher than previously reported in the general population. Further studies will need to be undertaken with a larger more diverse population to ascertain to confirm these findings.
References
- Young T, Palta M, Dempsey J, Skatrud J, Weber S, Badr S. The occurrence of sleep-disordered breathing among middle-aged adults. N Engl J Med. 1993 Apr 29;328(17):1230-5. [CrossRef] [PubMed]
- Choi SJ, Joo EY, Lee YJ, Hong SB. Suicidal ideation and insomnia symptoms in subjects with obstructive sleep apnea syndrome. Sleep Med. 2015 Sep;16(9):1146-50. [CrossRef] [PubMed]
- Guglielmi O, Lanteri P, Garbarino S. Association between socioeconomic status, belonging to an ethnic minority and obstructive sleep apnea: a systematic review of the literature. Sleep Med. 2019 May;57:100-106. [CrossRef] [PubMed]
- Haynes PL, Silva GE, Howe GW, Thomson CA, Butler EA, Quan SF, Sherrill D, Scanlon M, Rojo-Wissar DM, Gengler DN, Glickenstein DA. Longitudinal assessment of daily activity patterns on weight change after involuntary job loss: the ADAPT study protocol. BMC Public Health. 2017 Oct 10;17(1):793. [CrossRef] [PubMed]
- Sheehan DV, Lecrubier Y, Sheehan KH, Amorim P, Janavs J, Weiller E, Hergueta T, Baker R, Dunbar GC. The Mini-International Neuropsychiatric Interview (M.I.N.I.): the development and validation of a structured diagnostic psychiatric interview for DSM-IV and ICD-10. J Clin Psychiatry. 1998;59 Suppl 20:22-33;quiz 34-57. [PubMed]
- Brody DJ, Pratt LA, Hughes JP. Prevalence of Depression Among Adults Aged 20 and Over: United States, 2013-2016. NCHS Data Brief. 2018 Feb;(303):1-8. [PubMed]
- Crosby AE, Han B, Ortega LA, Parks SE, Gfroerer J; Centers for Disease Control and Prevention (CDC). Suicidal thoughts and behaviors among adults aged ≥18 years--United States, 2008-2009. MMWR Surveill Summ. 2011 Oct 21;60(13):1-22. [PubMed]
- Ejaz SM, Khawaja IS, Bhatia S, Hurwitz TD. Obstructive sleep apnea and depression: a review. Innov Clin Neurosci. 2011 Aug;8(8):17-25. [PubMed]
- Hobzova M, Prasko J, Vanek J, Ociskova M, Genzor S, Holubova M, Grambal A, Latalova K. Depression and obstructive sleep apnea. Neuro Endocrinol Lett. 2017 Oct;38(5):343-352. [PubMed]
- Jehan S, Auguste E, Pandi-Perumal SR, Kalinowski J, Myers AK, Zizi F, Rajanna MG, Jean-Louis G, McFarlane SI. Depression, Obstructive Sleep Apnea and Psychosocial Health. Sleep Med Disord. 2017;1(3):00012. Epub 2017 Oct 27. [PubMed]
- Albert PR. Why is depression more prevalent in women? J Psychiatry Neurosci. 2015 Jul;40(4):219-21. [CrossRef] [PubMed]
- Vanek J, Prasko J, Genzor S, Ociskova M, Kantor K, Holubova M, Slepecky M, Nesnidal V, Kolek A, Sova M. Obstructive sleep apnea, depression and cognitive impairment. Sleep Med. 2020 Aug;72:50-58. [CrossRef] [PubMed]
- Cao C, Hu L, Xu T, Liu Q, Koyanagi A, Yang L, Carvalho AF, Cavazos-Rehg PA, Smith L. Prevalence, correlates and misperception of depression symptoms in the United States, NHANES 2015-2018. J Affect Disord. 2020 May 15;269:51-57. [CrossRef] [PubMed]
- Gallup Inc. In U.S., Depression Rates Higher for Long-Term Unemployed. Gallup.com 2014. Available at https://news.gallup.com/poll/171044/depression-rates-higher-among-long-term-unemployed.aspx (accessed 5/16/22).
- Andreeva E, Magnusson Hanson LL, Westerlund H, Theorell T, Brenner MH. Depressive symptoms as a cause and effect of job loss in men and women: evidence in the context of organisational downsizing from the Swedish Longitudinal Occupational Survey of Health. BMC Public Health. 2015 Oct 12;15:1045. [CrossRef] [PubMed]
- Lewis-Fernández R, Das AK, Alfonso C, Weissman MM, Olfson M. Depression in US Hispanics: diagnostic and management considerations in family practice. J Am Board Fam Pract. 2005 Jul-Aug;18(4):282-96. [CrossRef] [PubMed]
- Udholm N, Fuglsang M, Lundbye-Christensen S, Bille J, Udholm S. Obstructive sleep apnea and risk of suicide and self-harm: a Danish Nationwide Cohort Study. Sleep. 2022 Feb 14;45(2):zsab286. [CrossRef] [PubMed]
- Mastekaasa A. Age variations in the suicide rates and self-reported subjective well-being of married and never married persons. J Community Appl Soc Psychol 1995;5:21–39. [CrossRef]
- Kessler RC, Berglund P, Borges G, Nock M, Wang PS. Trends in suicide ideation, plans, gestures, and attempts in the United States, 1990-1992 to 2001-2003. JAMA. 2005 May 25;293(20):2487-95. [CrossRef] [PubMed]
- Lorant V, Deliège D, Eaton W, Robert A, Philippot P, Ansseau M. Socioeconomic inequalities in depression: a meta-analysis. Am J Epidemiol. 2003 Jan 15;157(2):98-112. [CrossRef] [PubMed]
- Etindele Sosso FA, Matos E. Socioeconomic disparities in obstructive sleep apnea: a systematic review of empirical research. Sleep Breath. 2021 Dec;25(4):1729-1739. [CrossRef] [PubMed]
Acknowledgements
This research was supported by the National Heart, Lung, and Blood Institute (#1R01HL117995-01A1; PI: Haynes).
Cite as: Singh V, Haynes PL, Quan SF. Assessing Depression and Suicidality Among Recently Unemployed Persons with Obstructive Sleep Apnea and Socioeconomic Inequality. Southwest J Pulm Crit Care Sleep. 2022;24(5):81-88. doi: https://doi.org/10.13175/swjpccs020-22 PDF
Impact of Recent Job Loss on Sleep, Energy Consumption and Diet
Salma Batool-Anwar, MD, MPH
Candace Mayer
Patricia L. Haynes, PhD
Yilin Liu
Cynthia A. Thomson, PhD, RDN
Stuart F. Quan, MD
Division of Sleep and Circadian Disorders, Brigham and Women’s Hospital, Harvard Medical School, Boston, MA; Mel and Enid Zuckerman College of Public Health, University of Arizona, Tucson, AZ
Abstract
To examine how sleep quality and sleep duration affect caloric intake among those experiencing involuntary job loss.
Methods
Adequate sleep and self-reported dietary recall data from the Assessing Daily Activity Patterns through Occupational Transitions (ADAPT) study was analyzed. Primary sleep indices used were total sleep time, time spent in bed after final awakening, and sleep quality as measured by the Daily Sleep Diary (DSD). Mean Energy consumption (MEC) was the primary nutritional index. Secondary indices included diet quality using the Health Eating Index 2015 (HEI), and self-reported intake of protein, carbohydrates and fats.
Results
The study participants were comprised mainly of women (61%) and non-Hispanic white. The participants had at least 2 years of college education and mean body mass index of 30.2±8.08 (kg/m 2 (). The average time in bed was 541.8 (9 hrs) ±77.55 minutes and total sleep time was 461.1 (7.7 hrs) ±56.49 minutes. Mean sleep efficiency was 91±6%, self-reported sleep quality was 2.40±0.57 (0-4 scale, 4 = very good), and minutes earlier than planned morning awakening were 14.36±24.15. Mean HEI score was 47.41±10.92. Although the MEC was below national average for both men and women, male sex was associated with higher MEC. In a fully adjusted model sleep quality was positively associated with MEC.
Conclusion
Daily overall assessments of sleep quality among recently unemployed persons were positively associated with mean energy consumption. Additionally, the diet quality of unemployed persons was found to unhealthier than the average American and consistent with the relationship between poor socioeconomic status and lower diet quality.
Abbreviations
- SES: Socioeconomic status
- ADAPT: Assessing Daily Activity Patterns through Occupational Transitions
- UI: unemployment insurance
- MEC: mean energy consumption
- BMI: body mass index
- USDA: United States Department of Agriculture
- HEI: Healthy Eating Index
- DSD: Daily Sleep Diary
- TST: total sleep time
- EMA: earlier than desired morning awakening
- SD: Standard Deviation
- TIB: time in bed
Introduction
Obesity is a major public health concern; 38.3% of women and 34.3% of men in the United States are obese. It is not only the result of low physical activity and overconsumption of high energy yielding foods, socioeconomic status also plays a major role (1,2). Obesity disproportionately affects people of lower socioeconomic status (SES) in part because their limited financial resources result in consumption of calorically dense unhealthy food. This contributes to the risk of developing obesity (3).
A major determinant of SES is employment status. Unemployment is one indicator of a reduced SES and is associated with higher levels of stress. Unemployment includes involuntary job loss which is an important disruptive life event. It can cause additional unanticipated psychological and economic stress with the former afflicting women disproportionately (4). Involuntary job loss is positively associated with greater symptoms of depression, disruptions in daily routine changes and poor sleep quality (5). Unemployment has been shown to be positively associated with obesity (6,7). In one study, women were more likely to be diagnosed with obesity after involuntary job loss (8).
Sleep is another factor that affects obesity risk. Lower sleep quality and reductions in sleep duration have been shown to increase food intake resulting in becoming overweight or obese (9). Sleep deficiency can change the secretory pattern of leptin and ghrelin leading to hunger and a craving for calorically dense food (10,11).
There are no prior studies that have investigated the impact of whether sleep quality or sleep duration influences caloric consumption in those that have experienced involuntary job loss. The Assessing Daily Activity Patterns through Occupational Transitions (ADAPT) Study is an ongoing longitudinal cohort study of individuals who have suffered involuntary job loss. We analyzed cross sectional data from the baseline assessment of the ADAPT study and hypothesized that disrupted, short sleep would be associated with increased energy intake among these individuals.
Methods
Participants
Study participants were part of the on-going ADAPT Study, an 18-month longitudinal study examining changes in sleep, social rhythms, and obesity following an involuntary job loss (12). The study protocol and recruitment strategy have been described in detail previously. Briefly, all individuals who applied for unemployment insurance (UI) in the greater Tucson, Arizona and surrounding areas between October 2015 and December 2018 received study recruitment flyers within their UI intake packets. Interested individuals contacted study staff and completed phone screens assessing exclusion criteria; potentially eligible individuals were then scheduled for in-person screening visits. Individuals were eligible if they had experienced an involuntary job loss within 90 days of study enrollment, had been with their employer for at least six months, were currently employed less than 5 hours per week and did not complete any night shift work within the last 30 days. During the in-person screening, participants provided written informed consent, as well as information about their demographics, employment and medical history. They also were screened for homelessness, existing physiological and mental health conditions, substance abuse, and major sleep diagnoses which could interfere with social rhythms and sleep patterns. Those who passed screening completed validated mental health and sleep diagnostic interviews. An overnight at-home screening for sleep apnea was performed utilizing the ApneaLink PlusTM (ResMed, San Diego, CA) to exclude moderate sleep apnea as a cause of sleep disruption.
Data used in this analysis originated from the study’s baseline visit. Of the 446 adults who provided written consent, 191 participants met eligibility criteria and completed a baseline assessment visit, including an at-home data collection period lasting two weeks. Participants were considered for the current analysis if there was an acceptable assessment of sleep and diet on their sleep diaries and dietary recalls respectively for analysis. However, 8 participants were excluded as outliers because their mean energy consumption (MEC) was significantly less than commonly reported norms (13,14). Descriptive statistics for the study sample are reported in Table 1.

Click here to view Table 1 enlarged in a new window
Measures
Demographic and Anthropometric
Age, ethnicity and biological sex were collected during the initial interview. Height and weight were measured to calculate the body mass index (kg/m2,BMI).
Diet Assessment
During the two-week, at-home baseline data collection period, participants completed up to three 24-hour dietary recalls administered by trained diet assessors at the Behavioral Measurements and Interventions Shared Resource of the University of Arizona Cancer Center utilizing the gold-standard USDA Multi-pass Dietary recall and the Nutrient Database System of the University of Minnesota for nutrient analysis (15,16). These interviews were supported by the Remote Food Photography Method, in which participants took pictures of all food and beverages prior to consumption, as well as after they had finished eating and drinking (17). Photos were used to review recall as a final verification of the multi-pass data. The diet recalls provided information on the types and quantity of food, including energy and nutrient values. At least 3 dietary recalls were completed by 172 participants (95.6% of the cohort). The primary index for this analysis was MEC (kcal). Secondary indices included diet quality estimated using the Health Eating Index 2015 (HEI) using standardized approaches to score, and self-reported intake of protein, carbohydrates and fats (18).
Sleep Measures
Sleep variables of interest were measured using the valid and reliable Daily Sleep Diary (DSD), the recommended subjective sleep assessment instrument of the insomnia research consensus panel (19). Upon wakening from their sleep, participants completed the DSD via mobile application. The DSD was completed at least 15 times by 170 participants with only 3 participants completing less than 4 days of diary data. The primary indices of interest were total sleep time (TST) and minutes earlier than desired morning awakening (EMA) as indices of sleep duration. Additionally, sleep onset latency, sleep efficiency, number of wakes after sleep onset episodes and time in bed were calculated. Self-reported sleep quality was assessed using the 5 point Likert scale incorporated into the DSD (19).
Statistical Analysis
For baseline characteristics, mean (SD) for continuous variables and percentages for categorical variables were calculated. After removing the extreme outliers we fitted linear regression models to predict MEC and HEI with sleep indices as predictors. Finally, five models were performed in multiple regression analysis. These models were adjusted for age, gender, education level, and body mass index. The results from regression analysis are presented as β-coefficients (standardized/unstandardized) with p values. In Model 1 we included energy consumption as predicted by total sleep time. In Model 2 we included energy consumption as predicted by time in bed. In Model 3, we included energy consumption as predicted by early morning awakenings. In Model 4, we included energy consumption as predicted by sleep quality. In our final Model 5, we included energy consumption as predicted by all sleep indices combined from other models. The level of statistical significance for all models was set at 0.05. To test the robustness of the analysis, we conducted a sensitivity analysis by excluding 3 participants who did not completed the DSD at least four times. All statistical analyses were done using STATA version 11 (StataCorp, LLC, College Station, TX, USA).
Results
The demographic and anthropometric characteristics of the study population are described in Table 1 (see above). Most participants were women (61%) and non-Hispanic white with the remainder primarily Hispanic. On average, study participants had at least 2 years of college education and had a mean body mass index of 30.22 (kg/m2).
As shown on Table 1, average time in bed (TIB) and total sleep time (TST) were 541.8 minutes (9.0 hrs) ±77.55 and 461.1 minutes (7.6 hrs) ±56.49 minutes respectively. However, the range was large with minimums of (5.7 hrs for TIB/ 5.2 hrs for TST) and maximums of (15.2 hrs for TIB and 10.1 for TST) respectively. Mean sleep efficiency was within normal limits (91%). There generally were few episodes of wake after sleep onset, and only a small amount of time (14 min) spent awake in the morning (EMA). Self-reported sleep quality was 2.39 using a 5 point Likert scale from 0 to 4 representing very poor, poor, good and very good sleep respectively.
Table 2 shows the MEC as well as the intake of protein, carbohydrates, fats, fruits and vegetables.

Click here to view Table 2 enlarged in a new window
Normative values for men and women in the United States are provided for comparison. The MEC was below averages for national data in both men and women (20-21). Absolute intake of protein and carbohydrates was higher than recommended levels, but was within recommended levels as a percent of energy consumption. Absolute intake of total fat was at the higher limit of recommended levels, but exceeded them as a percent of energy consumption. Consumption of fruit and vegetables were below recommendations. The HEI also was markedly reduced (Men: 43.9±8.9; Women: 49.9±10.9 vs. 59 for average American diet) (21).
Univariate regression models examining the impact of age, gender, education and BMI on MEC are presented in Table 3.

Click here to view Table 3 enlarged in a new window
Male gender was associated with higher MEC but age, education and BMI were not. Univariate regression models assessing the effect of the various sleep variables demonstrated that only TST, TIB, EMA and sleep quality significantly affected MEC (data not shown). Therefore, each of these factors were included by themselves in multivariate regression models that also incorporated age, gender, education and BMI (Table 3). Sleep quality was positively associated with MEC while EMA was negatively associated. There was no significant relationship between MEC and TST. A final model integrating TST, TIB, EMA and sleep quality showed that only sleep quality was associated with higher MEC, but EMA had no significant impact. In a sensitivity analysis, we excluded the participants who had not completed the DSD at least 4 times. However, this did not materially change the results.
Regression models were calculated to examine the impact of sleep on dietary components and the HEI. None were shown to be significant (data not shown).
Discussion
In this study of persons who recently involuntarily became unemployed, we did not find any significant associations between their MEC and various parameters related to sleep duration and sleep fragmentation. However, overall positive subjective sleep quality was associated with greater MEC. Individual dietary components and the HEI also were not related to sleep duration or fragmentation but did indicate that the diet of involuntarily unemployed persons is of lower quality, based on HEI 2015 scoring, than average for US adults (18,21).
In most, but not all studies, sleep duration has been shown to be inversely associated with MEC. In contradistinction, our analyses did not find any significant relationship with respect to either TST or TIB. Although minutes spent awake in the morning before getting out of bed (EMA) was inversely associated with MEC, this association was borderline and not significant in a fully adjusted model. Similarly, sleep efficiency and number of wakes after sleep onset episodes were not related to MEC. Explanations for increased MEC with restricted sleep duration or fragmentation include but are not limited to changes in the relative levels of satiety and hunger hormones, greater available time to eat, altered timing of meals and hedonic feeding (22). Our data suggest that in this population, the impact of these factors is not sufficient enough to alter MEC. Importantly, a large body of evidence suggests under-reporting of dietary intake is associated with obesity, female sex and lower education and may be more common among Hispanics who accounted for 33% of our sample (23,24). Systematic under-reporting of intake may have undermined our ability to capture significant associations between energy intake and sleep in this study.
Subjective sleep quality was positively correlated with MEC; better sleep quality was associated with higher levels of MEC. The direction of this finding is inconsistent with previous studies that have noted better sleep quality is associated with more nutritious diets and less obesity (25,26). The lack of agreement between daily subjective overall sleep quality, and specific individual subjective sleep quality metrics as well as objective sleep quality instruments (e.g., actigraphy) has been reported previously. In a recent study of sleep quality in older adults, the specific measures assessed by the DSD used in this study was compared to the Pittsburgh Sleep Quality Index as well as subjective sleep quality recorded in the diary. Little agreement was observed among all three measures (27). Furthermore, subjective estimates of sleep or alertness have been shown to be a poor predictor of other aspects of human behavior and performance (28,29). Our findings provide a unique perspective on the use of the DSD, an instrument that is considered a gold-standard for the assessment of sleep in persons with insomnia subject to less retrospective recall bias that global estimates of sleep quality.
We observed that the diet of recently unemployed persons differed in many categories from recommendations and guidelines made by the Institute of Medicine and the US Department of Agriculture. Additionally, the HEI of the average American is already suboptimal at 59 and mean scores appear to be even lower in our sample of unemployed individuals. Food cost is inversely correlated with diet quality and is one factor that contributes to the higher prevalence of unhealthy diets in those with lower socioeconomic status (30). Our findings extend these previous observations by demonstrating the adverse economic impact of recent job loss is associated with worse diet quality.
In conclusion, in recently unemployed persons, subjective diary assessments of sleep quality were not associated with mean energy consumption. However, the diet quality of unemployed persons was found to unhealthier than the average American and consistent with the relationship between poor socioeconomic status and lower diet quality.
Acknowledgements
The authors would like to thank the staff and participants of the Assessing Daily Activity Patterns Through Occupational Transitions Study (ADAPT). The authors would like to gratefully acknowledge the assistance of the Arizona Department of Economic Security in study recruitment, and the support of the University of Arizona Collaboratory for Metabolic Disease Prevention and Treatment.
The ADAPT study was supported by the US National Heart, Lung, and Blood Institute (HL117995).
References
- Ogden CL, Carroll MD, Fryar CD, Flegal KM. Prevalence of Obesity Among Adults and Youth: United States, 2011-2014. NCHS Data Brief. 2015 Nov;(219):1-8. [PubMed]
- Bhupathiraju SN, Hu FB. Epidemiology of Obesity and Diabetes and Their Cardiovascular Complications. Circ Res. 2016 May 27;118(11):1723-35.[CrossRef] [PubMed]
- Cheon BK, Hong YY. Mere experience of low subjective socioeconomic status stimulates appetite and food intake. Proc Natl Acad Sci U S A. 2017 Jan 3;114(1):72-77. [CrossRef] [PubMed]
- Baik K, Hosseini M, Priesmeyer HR. Correlates of psychological distress in involuntary job loss. Psychol Rep. 1989 Dec;65(3 Pt 2):1227-33. [CrossRef] [PubMed]
- Berchick ER, Gallo WT, Maralani V, Kasl SV. Inequality and the association between involuntary job loss and depressive symptoms. Soc Sci Med. 2012 Nov;75(10):1891-4. [CrossRef] [PubMed]
- Akil L, Ahmad HA. Effects of socioeconomic factors on obesity rates in four southern states and Colorado. Ethn Dis. 2011 Winter;21(1):58-62. [PubMed]
- Latif E. The impact of macroeconomic conditions on obesity in Canada. Health Econ. 2014 Jun;23(6):751-9. [CrossRef] [PubMed]
- Schröder M. Jobless now, sick later? Investigating the long-term consequences of involuntary job loss on health. Adv Life Course Res. 2013 Mar;18(1):5-15. [CrossRef] [PubMed]
- Parvaneh K, Poh, B., Hajifaraji, M., & Ismail, M. Less Sleep Duration and Poor Sleep Quality Lead to Obesity. Proceedings of the Nutrition Society 2016;75(OCE1).
- Spiegel K, Leproult R, L'hermite-Balériaux M, Copinschi G, Penev PD, Van Cauter E. Leptin levels are dependent on sleep duration: relationships with sympathovagal balance, carbohydrate regulation, cortisol, and thyrotropin. J Clin Endocrinol Metab. 2004 Nov;89(11):5762-71. [CrossRef] [PubMed]
- Van Cauter E, Leproult R, Plat L. Age-related changes in slow wave sleep and REM sleep and relationship with growth hormone and cortisol levels in healthy men. JAMA. 2000 Aug 16;284(7):861-8. [CrossRef] [PubMed]
- Haynes PL, Silva GE, Howe GW, et al. Longitudinal assessment of daily activity patterns on weight change after involuntary job loss: the ADAPT study protocol. BMC Public Health. 2017 Oct 10;17(1):793. [CrossRef] [PubMed]
- Vasquez MM, Goodwin JL, Drescher AA, Smith TW, Quan SF. Associations of dietary intake and physical activity with sleep disordered breathing in the Apnea Positive Pressure Long-Term Efficacy Study (APPLES). J Clin Sleep Med. 2008 Oct 15;4(5):411-8. [PubMed]
- Rock CL, Thornquist MD, Kristal AR, et al. Demographic, dietary and lifestyle factors differentially explain variability in serum carotenoids and fat-soluble vitamins: baseline results from the sentinel site of the Olestra Post-Marketing Surveillance Study. J Nutr. 1999 Apr;129(4):855-64. [CrossRef] [PubMed]
- Subar AF, Thompson FE, Potischman N, Forsyth BH, Buday R, Richards D, McNutt S, Hull SG, Guenther PM, Schatzkin A, Baranowski T. Formative research of a quick list for an automated self-administered 24-hour dietary recall. J Am Diet Assoc. 2007 Jun;107(6):1002-7. [CrossRef] [PubMed]
- Feskanich D, Sielaff BH, Chong K, Buzzard IM. Computerized collection and analysis of dietary intake information. Comput Methods Programs Biomed. 1989 Sep;30(1):47-57. [CrossRef] [PubMed]
- Martin CK, Han H, Coulon SM, Allen HR, Champagne CM, Anton SD. A novel method to remotely measure food intake of free-living individuals in real time: the remote food photography method. Br J Nutr. 2009 Feb;101(3):446-56. [CrossRef] [PubMed]
- U.S. Department of Agriculture How the HEI Is Scored. 03/16/2018. Available at https://www.fns.usda.gov/how-hei-scored (accessed 11-11-21).
- Buysse DJ, Ancoli-Israel S, Edinger JD, Lichstein KL, Morin CM. Recommendations for a standard research assessment of insomnia. Sleep. 2006 Sep;29(9):1155-73. [CrossRef] [PubMed]Erratum in: Sleep. 2006 Nov 1;29(11):1380.
- U.S. Department of Agriculture and U.S. Department of Health and Human Services. Dietary Guidelines for Americans, 2020-2025. 9th Edition. December 2020. Available at https://dietaryguidelines.gov/ (accessed 11-11-21).
- Department of Health and Human Services and U.S. Department of Agriculture. 2015–2020 Dietary Guidelines for Americans. 2015–2020 Dietary Guidelines for Americans. 8th Edition. December 2015. Available at https://health.gov/our-work/food-nutrition/previous-dietary-guidelines/2015 (accessed 11-11-21).
- Dashti HS, Scheer FA, Jacques PF, Lamon-Fava S, Ordovás JM. Short sleep duration and dietary intake: epidemiologic evidence, mechanisms, and health implications. Adv Nutr. 2015 Nov 13;6(6):648-59. [CrossRef] [PubMed]
- Kye S, Kwon SO, Lee SY, Lee J, Kim BH, Suh HJ, Moon HK. Under-reporting of Energy Intake from 24-hour Dietary Recalls in the Korean National Health and Nutrition Examination Survey. Osong Public Health Res Perspect. 2014 Apr;5(2):85-91. [CrossRef] [PubMed]
- Bothwell EK, Ayala GX, Conway TL, Rock CL, Gallo LC, Elder JP. Underreporting of food intake among Mexican/Mexican-American Women: rates and correlates. J Am Diet Assoc. 2009 Apr;109(4):624-32. [CrossRef] [PubMed]
- St-Onge MP, Mikic A, Pietrolungo CE. Effects of Diet on Sleep Quality. Adv Nutr. 2016 Sep 15;7(5):938-49. [CrossRef] [PubMed]
- Ding C, Lim LL, Xu L, Kong APS. Sleep and Obesity. J Obes Metab Syndr. 2018 Mar 30;27(1):4-24. [CrossRef] [PubMed]
- Landry GJ, Best JR, Liu-Ambrose T. Measuring sleep quality in older adults: a comparison using subjective and objective methods. Front Aging Neurosci. 2015 Sep 7;7:166. [CrossRef] [PubMed]
- Van Dongen HP, Maislin G, Mullington JM, Dinges DF. The cumulative cost of additional wakefulness: dose-response effects on neurobehavioral functions and sleep physiology from chronic sleep restriction and total sleep deprivation. Sleep. 2003 Mar 15;26(2):117-26. [CrossRef] [PubMed] Erratum in: Sleep. 2004 Jun 15;27(4):600.
- Zavecz Z, Nagy T, Galkó A, Nemeth D, Janacsek K. The relationship between subjective sleep quality and cognitive performance in healthy young adults: Evidence from three empirical studies. Sci Rep. 2020 Mar 17;10(1):4855. [CrossRef] [PubMed]
- Rehm CD, Monsivais P, Drewnowski A. Relation between diet cost and Healthy Eating Index 2010 scores among adults in the United States 2007-2010. Prev Med. 2015 Apr;73:70-5. [CrossRef] [PubMed]
Long-term All-Cause Mortality Risk in Obstructive Sleep Apnea Using Hypopneas Defined by a ≥3 Percent Oxygen Desaturation or Arousal
Rohit Budhiraja, MD1
Stuart F. Quan, MD1,2
1Division of Sleep and Circadian Disorders, Brigham and Women’s Hospital, Boston, MA
2Arizona Asthma and Airways Research Center, University of Arizona College of Medicine, Tucson, AZ
Abstract
Study Objectives: Some prior studies have demonstrated an increase in mortality associated with obstructive sleep apnea (OSA) utilizing a definition of OSA that requires a minimum 4% oxygen desaturation to identify a hypopnea. No large community-based studies have determined the risk of long-term mortality with OSA with hypopneas defined by a ≥3% O2 desaturation or arousal (AHI3%A).
Methods: Data from 5591 Sleep Heart Health Study participants without prevalent cardiovascular disease at baseline who underwent polysomnography were analyzed regarding OSA diagnosed using the AHI3%A criteria and all-cause mortality over a mean follow up period of 10.9±3.2 years.
Results: There were 1050 deaths in this group during the follow-up period. A Kaplan-Meir plot of survival revealed a reduction in survival with increasing AHI severity. Cox proportional hazards regression models revealed significantly increased all-cause mortality risk with increasing AHI, hazard ratio (HR, 95% CI) 1.13 (1.04-1.23), after adjusting for age, sex, race, BMI, cholesterol, HDL, self-reported hypertension and/or diabetes and smoking status. In categorical models, the mortality risk was significantly higher with severe OSA [adjusted HR 1.38 (1.09-1.76)]. When stratified by gender or age, severe OSA was associated with increased risk of death in men [adjusted HR 1.14 (1.01-1.28)] and in those <70 years of age [adjusted HR 1.51 (1.02-2.26)]. In contrast, AHI severity was not associated with increased mortality in women or those ≥70 years of age in fully adjusted models.
Conclusion: Severe AHI3%A OSA is associated with significantly increased mortality risk, especially in men and those <70 years of age.
Introduction
Obstructive sleep apnea (OSA) is a prevalent disorder associated with diverse physiological changes. Intermittent hypoxia-reoxygenation, sympathetic nervous system activation and endothelial dysfunction have been demonstrated in OSA and likely contribute to adverse outcomes including daytime sleepiness, hypertension, coronary artery disease, and stroke (1,2). It is also associated with increased mortality, especially in those with more severe disease (3-7).
The severity of OSA is most frequently categorized using the apnea hypopnea index (AHI). However, the definition of the ‘hypopnea’ component of this index remains a matter of controversy. American Academy of Sleep Medicine (AASM) guidelines recommend that hypopnea be defined as a 30% or greater reduction in the airflow associated with either ≥3% decrease in oxyhemoglobin saturation, or an arousal from sleep (AHI3%A) (8). However, Centers for Medicare and Medicaid Services (CMS), along with several other payors in the United States, utilize an alternate hypopnea definition that requires at least a 4% desaturation and does not recognize arousals for defining hypopnea (AHI4%). The reimbursement for OSA therapy from these payors is reserved for the subset of patients that meets this more stringent definition of OSA. Unfortunately, this policy systematically deprives some patients, even those with clear symptoms attributable to sleep apnea such as increased sleepiness, of appropriate therapy, since they do not meet the higher diagnostic cutoff mandated by this definition.
Much of the current status quo may be related to a lack of substantial data evaluating the impact of hypopnea events associated with less severe desaturation or arousals on diverse OSA outcomes. In contrast, several large cohort studies have established a robust relationship between OSA defined using the AHI4% definition and cardiovascular outcomes (9-11). Two large community-based longitudinal studies demonstrating an association between OSA severity and all-cause mortality, that from Sleep Heart Health Study (SHHS) cohort (3) and that from Wisconsin Sleep Cohort (5), also utilized the AHI4% definition. However, no large community-based longitudinal studies have assessed the association between OSA diagnosed using the AHI3%A definition and mortality. The current study utilized data from SHHS to assess the relationship between OSA defined by the AHI3%A at baseline and all-cause mortality over an 11-year follow up period.
Methods
Participants
The Sleep Heart Health Study (SHHS) was a multicenter cohort study that investigated prospectively the relationship between OSA and cardiovascular diseases in the United States. Details of the rationale and study design have been described elsewhere (12). Recruitment began in 1995 with eventual enrollment of 6,441 participants, 40 years of age and older, from several ongoing “parent” cardiovascular and respiratory disease cohorts who were initially assembled between 1976 and 1995 (13). These “parent” cohorts consisted of the Offspring and the Omni Cohorts of the Framingham Heart Study in Massachusetts; the Hagerstown, MD, and Minneapolis, MN, sites of the Atherosclerosis Risk in Communities Study; the Hagerstown, MD, Pittsburgh, PA, and Sacramento, CA, sites of the Cardiovascular Health Study; 3 hypertension cohorts (Clinic, Worksite, and Menopause) in New York City; the Tucson Epidemiologic Study of Airways Obstructive Diseases and the Health and Environment Study; and the Strong Heart Study of American Indians in Oklahoma, Arizona, North Dakota, and South Dakota. Between 1995 and 1997, these participants underwent a home sleep evaluation that included full unattended polysomnography to determine whether they had OSA. Subsequently, they were followed for mortal events by their parent cohorts. Follow-up duration was 10.9±3.2 years (Mean±SD). As shown in Figure 1, consent was withdrawn by 134 participants from the Arizona cohort of the Strong Heart Study because of sovereignty issues after the end of the follow-up period.

Figure 1. Diagram of Sleep Heart Health Study (SHHS) analytic cohort.
Participants with self-reported prevalent cardiovascular disease (CVD: coronary heart disease, stroke or congestive heart failure) at enrollment also were excluded. Consequently, there were 5,591 participants in the analytic cohort. Parent cohort data were used for documentation of age, height, sex and ethnicity. Co-morbid self-reported diabetes, cardiovascular disease (CVD), concurrent treatment for OSA and smoking status were ascertained from parent cohort data or from responses on health interview and sleep habit questionnaires administered on the evening of the polysomnography home visit (vide infra). Hypertension status was derived as previously described from blood pressure measurements on the night of the home visit and hypertensive medication use (14). Body mass index (BMI) was calculated as weight (kg)/height (m2).
Institutional review boards for human subjects’ research of the respective parent cohorts approved the study. Informed written consent was obtained from all participants at the time of their recruitment.
Polysomnography and Home Visit
Participants underwent overnight in-home polysomnograms using the Compumedics Portable PS-2 System (Abbottsville, Victoria, Australia) administered by trained technicians (15). The home visits were performed by two-person, mixed-sex teams in visits that lasted 1.5 to 2 hours. At the time of the home visit, blood pressure was measured manually in triplicate in a seated position after 5 minutes of rest (16). The average of the second and third measurements was used. Body weight was measured using a digital scale.
The SHHS recording montage for both the initial and follow-up sleep evaluations consisted of electroencephalogram (C4/A1 and C3/A2), right and left electrooculogram, a bipolar submental electromyogram, thoracic and abdominal excursions (inductive plethysmography bands), airflow (detected by a nasal-oral thermocouple [Protec, Woodinville, WA]), oximetry (finger pulse oximetry [Nonin, Minneapolis, MN]), electrocardiogram and heart rate (using a bipolar electrocardiogram lead), body position (using a mercury gauge sensor), and ambient light (on/off, by a light sensor secured to the recording garment). Equipment and sensors were applied and calibrated during the evening home visit by a study certified technician. In the morning, the equipment and the data stored in real time on PCMCIA cards, were retrieved and downloaded to the computers of each respective clinical site. The data were locally reviewed, and then forwarded to a central reading center (Case Western Reserve University, Cleveland, OH). Comprehensive descriptions of polysomnography scoring and quality-assurance procedures have been previously published (15,17). In brief, sleep was scored according to guidelines developed by Rechtschaffen and Kales (18). Strict protocols were maintained to ensure comparability among centers and technicians. Intra-scorer and inter-scorer reliabilities were high (17).
The apnea hypopnea index (AHI) was calculated for each participant using the AASM recommended definition of hypopnea. Thus, hypopneas were identified if the amplitude of a measure of flow or volume (detected by the thermocouple or thorax or abdominal inductance band signals) was reduced discernibly (at least 25% lower than baseline breathing) for at least 10 seconds, did not meet the criteria for apnea and the event was associated with either a ≥3% oxygen desaturation from baseline or terminated with electroencephalographic evidence of an arousal. An apnea was defined as a complete or almost complete cessation of airflow, as measured by the amplitude of the thermocouple signal, lasting at least 10 seconds.
Statistical Analyses
Mean and standard deviation were used to provide an overall description of the data used in the analyses. For analyses using the AHI, each participant’s AHI was assigned to one of 4 OSA severity categories: No OSA (AHI <5 /hour), Mild (AHI ≥5 and <15 /hour), Moderate (AHI ≥15 and < 30/hour) and Severe (AHI ≥30). For some analyses, because values for AHI were extremely left skewed, a natural log transformation was performed to express AHI as a continuous factor in the form of lnAHI+0.1. To nullify the impact of 0 values of the AHI, 0.1 was added to the ln function. Mortality rates were computed by dividing the number of deaths by accumulated person-years at risk.
Analysis of variance was used to test for differences within continuous variables and 2 was employed for categorial variables. A Kaplan-Meir plot was computed to assess the overall relationship between severity of OSA and mortality. Cox proportional hazards regression models were calculated to examine the association between AHI as a categorical and continuous factor and mortality. Covariates included in the models were sex, race, age, BMI, cholesterol, high density lipoprotein (HDL), hypertension and/or diabetes and smoking status. Consistent with a previous study assessing mortality in SHHS, age was dichotomized into those <70 and those ≥ 70 years (3). Race was stratified as non-Hispanic White or other. Smoking was recategorized into those who were current or former smokers and those who were never smokers. Prevalent hypertension or self-reported diabetes was expressed as present or absent. Three models were constructed: Model 1 adjusted for age, race and sex, Model 2 adjusted for covariates in Model 1 plus BMI and Model 3 adjusted for covariates in Models 1 and 2 plus cholesterol, HDL, hypertension/diabetes and smoking status.
Analyses were performed using IBM SPSS Statistics v27 (Armonk, NY). The survival package in R was used to obtain the Kaplan Meir plot. A p value of <0.05 was considered statistically significant.
Results
Demographic and clinical characteristics of the cohort stratified by AHI are shown in Table 1.
Table 1. Baseline Characteristics Stratified by Apnea Hypopnea Indexa,b

Age and BMI increased across AHI strata as well as the % of men, current/ex-smokers, diabetic/hypertensives and non-Hispanic Whites. In contrast, HDL decreased. No changes were observed for cholesterol or % receiving OSA treatment.
Figure 2 depicts the Kaplan-Meir plot of survival over ~11 years of follow-up stratified by AHI categories.

Figure 2. Kaplan Meir plot of survival stratified by apnea hypopnea (AHI) severity.
There was a clear reduction in survival with apparent differences related to AHI severity. However, because several covariates also impacted survival across AHI strata, multivariate proportional hazard modelling was employed as shown in for all participants as shown in Table 2.
Table 2. Hazard Ratios (95% confidence intervals) for All-Cause Mortality

There were 1,050 deaths with full covariate data available for analysis. For the categorical modelling, there was an increase in the hazard ratio as the AHI severity increased, but this was only statistically significant at an AHI ≥30 /h (HR: 1.36, 95% CI: 1.09-1.69). Increasing model complexity did not alter this finding. A model using AHI as a continuous factor also demonstrated a significant association between severity of AHI and increasing mortality in a fully adjusted model. A sensitivity analysis where concurrent OSA treatment was included also did not change this relationship.
Because previous analyses have demonstrated differences in mortality between men and women, sex stratified analyses were performed as shown in Table 3.
Table 3. Hazard Ratios (95% confidence intervals) for All-Cause Mortality Stratified by Sex

These findings confirmed that in men AHI severity in both categorical and continuous analyses was associated with increased mortality. As observed in the combined analyses, this was only statistically significant in the continuous analysis (HR: 1.14, 95% CI: 1.01-1.28) although strong trends were noted in the categorical analyses in all models. In women, however, the relationship between AHI severity and mortality was less robust. In demographic (Model 1) and demographic/anthropometric (Model 2) adjusted analyses, an AHI ≥30 /h was associated with increased mortality, but this observation was attenuated and lost statistical significance in the fully adjusted categorical and continuous models.
Table 4 shows age stratified analyses comparing those <70 years to those ≥70 years of age.
Table 4. Hazard Ratios (95% confidence intervals) for All-Cause Mortality Stratified by Age at 70 years

In those who were <70 years, AHI severity was strongly associated with increased mortality. Although this finding was statistically significant only at AHI ≥30 /h in the fully adjusted model, it was significant at AHI 15-29.9/h in less complex models (HR: 1.45, 95% CI: 1.03-2.04) and approached significance in the fully adjusted model (HR: 1.41, 95% CI: 0.98-2.00). In contrast, AHI severity was not found to be associated with increased mortality among those ≥70 years of age in either categorial or continuous models.
Of the 1,050 deaths used in the proportional hazard models, 258 (24.7%) were classified as related to CVD. In analyses restricted to CVD deaths, a Kaplan-Meir plot (not shown) indicated a reduction in survival with increasing OSA severity (Log Rank 2 = 11.2-20.4 for comparisons vs. AHI <5 /h, p<.001). However, in fully adjusted proportional hazard models, no differences in survival attributable to OSA were observed.
Discussion
The current study demonstrated using the AHI3%A definition of hypopnea, a significant association between increasing severity of AHI and all-cause mortality in a model adjusted for relevant anthropometric and demographic factors and clinical co-morbidities. In stratified analyses, this association was more robust among men than in women, and those below 70 years of age compared to the older subjects.
Notably, some earlier studies have demonstrated an increase in mortality associated with OSA. An 18-year follow-up from Wisconsin cohort revealed a significantly increased hazard ratio for all-cause mortality and cardiovascular mortality in severe OSA (5). Punjabi et al. (3) used data from SHHS and demonstrated an increase in all-cause mortality with severe OSA, particularly in men aged 40–70, during an average follow-up period of 8.2 years. Both these studies utilized the AHI4% criteria for OSA diagnosis. Similarly, Martínez-García (19) utilized AHI4% criteria in a clinic population of 939 elderly (median follow-up, 69 months) and found HR of 2.25 for cardiovascular mortality in the untreated severe OSA group. A study from Denmark included 22,135 OSA patients found that male gender, age>40 years, diabetes (types 1 and 2), hypertension, and heart failure were associated with greater mortality (criteria for hypopnea not specified (6). Marin et al. (10) also noted increased fatal and non-fatal cardiovascular events in men with untreated severe OSA diagnosed using the AHI4% criteria during a mean 10.1 years follow-up period. A meta-analysis with 11,932 patients from 6 prospective observational studies found severe OSA to be a strong independent predictor for cardiovascular and all-cause mortality (4). Finally, a meta-analysis of 27 cohort studies included 3,162,083 participants showed higher all-cause mortality in severe OSA and lower mortality in CPAP-treated than in untreated patients (7). Virtually all of these aforementioned studies utilized a definition of OSA requiring a minimum 4% oxygen desaturation to identify a hypopnea.
To our knowledge, our study is the first large community-based study to assess the association between OSA diagnosed using the AHI3%A criteria and mortality. Severe OSA was associated with a higher mortality, especially in those <70 years of age, and in men. Consistent with our findings, an earlier study in a clinical population of over 10,000 adults observed OSA diagnosed utilizing AHI3%A criteria predicted incident sudden cardiac death (20). The higher mortality risk in men and in younger people is similar to that reported in other analyses from this database using AHI4% criteria (3,21). Our results provide evidence that the more liberal AHI3%A criteria is associated with increased all-cause mortality thus providing further justification for its use in identifying persons with OSA who may benefit from treatment.
We observed that approximately 25% of the deaths in our analytic cohort were attributable to CVD. Data from the Wisconsin Sleep Cohort indicate that excess mortality associated with OSA over a 18 year follow-up is partially related to CVD (5). Our unadjusted analyses are consistent with this observation. However, our study did not have sufficient power in adjusted models to replicate it.
There are several factors that could explain the association between OSA and increased mortality. OSA increases the risk for hypertension, cardiovascular disease, diabetes, and stroke and can, thus, increase mortality. Hypoxemic burden has been suggested to be a conspicuous factor conferring an increased mortality risk (22). Other factors, however, may also play a notable role. Analyses from 5,712 participants revealed that short respiratory event duration, a marker for low arousal threshold, was associated with higher mortality risk (21). The authors hypothesized that the shorter event duration reflected greater “arousability”, resulting in greater sleep fragmentation, shorter sleep, and excess sympathetic tone, and hence increased mortality. Arousals are associated with an increase in the sympathetic activity and a decrease in the parasympathetic activity and data support their role in the development of hypertension.
From a clinical perspective, utilizing the AHI4% criteria in lieu of AHI3%A to identify persons as having OSA impacts those who are classified as having OSA by the latter standard, but not the former. Using the SHHS database, we found that 36.1% of individuals fall into this category. Importantly, similar to persons who were classified as having OSA by both criteria, we observed that this group who were designated as having OSA by only AHI3%A criteria had increased rates of prevalent and incident hypertension (23,24). There also was a significant association with CVD (25). Combined with these previous studies, the current analyses demonstrating increased mortality associated with OSA defined by AHI3%A criteria provide evidence that use of this more liberal definition will benefit patients.
This study has several strengths. SHHS is large, ethnically diverse cohort, making the results more generalizable. The cohorts were community-based, obviating any referral bias. Polysomnography, the gold standard diagnostic test for OSA, was performed on all individuals. The substantive database allowed controlling for multiple confounders. Finally, the participants were followed for an ample time with the average follow-up period of 11 years.
The study also has some limitations. First, being a community derived cohort, the severity of OSA seen in SHHS was generally mild to moderate. The outcomes, including mortality, would be expected to be worse in a clinical cohort with higher severity of sleep apnea. Secondly, while the current study included a substantial number of potential covariates in the models, residual confounding from other factors may have occurred. Thirdly, the severity of OSA may have changed over the follow up period. Fourthly, while the follow-up period of the study was long, it is possible that an even longer follow-up period may have allowed a better estimate of the long-term impact of OSA on mortality. Finally, although the study demonstrated increased mortality risk, elucidation of the mechanisms thereof was beyond the scope of this study.
In conclusion, the current study demonstrated in a large community-based cohort that even OSA defined by a more liberal AHI3%A is associated with increased mortality. Considering the adverse outcomes associated with OSA, a restrictive definition that excludes these persons from warranted OSA therapy is potentially deleterious to overall health with significant individual and healthcare implications.
References
- Javaheri S, Barbe F, Campos-Rodriguez F, et al. Sleep Apnea: Types, Mechanisms, and Clinical Cardiovascular Consequences. J Am Coll Cardiol. 2017 Feb 21;69(7):841-858. [CrossRef] [PubMed]
- Budhiraja R, Parthasarathy S, Quan SF. Endothelial dysfunction in obstructive sleep apnea. J Clin Sleep Med. 2007 Jun 15;3(4):409-15. [PubMed]
- Punjabi NM, Caffo BS, Goodwin JL, Gottlieb DJ, Newman AB, O'Connor GT, Rapoport DM, Redline S, Resnick HE, Robbins JA, Shahar E, Unruh ML, Samet JM. Sleep-disordered breathing and mortality: a prospective cohort study. PLoS Med. 2009 Aug;6(8):e1000132. [CrossRef] [PubMed]
- Ge X, Han F, Huang Y, Zhang Y, Yang T, Bai C, Guo X. Is obstructive sleep apnea associated with cardiovascular and all-cause mortality? PLoS One. 2013 Jul 25;8(7):e69432. [CrossRef] [PubMed]
- Young T, Finn L, Peppard PE, Szklo-Coxe M, Austin D, Nieto FJ, Stubbs R, Hla KM. Sleep disordered breathing and mortality: eighteen-year follow-up of the Wisconsin sleep cohort. Sleep. 2008 Aug;31(8):1071-8. [PubMed]
- Jennum P, Tønnesen P, Ibsen R, Kjellberg J. Obstructive sleep apnea: effect of comorbidities and positive airway pressure on all-cause mortality. Sleep Med. 2017 Aug;36:62-66. [CrossRef] [PubMed]
- Fu Y, Xia Y, Yi H, Xu H, Guan J, Yin S. Meta-analysis of all-cause and cardiovascular mortality in obstructive sleep apnea with or without continuous positive airway pressure treatment. Sleep Breath. 2017 Mar;21(1):181-189. [CrossRef] [PubMed]
- Berry RB, Budhiraja R, Gottlieb DJ, et al. Rules for scoring respiratory events in sleep: update of the 2007 AASM Manual for the Scoring of Sleep and Associated Events. Deliberations of the Sleep Apnea Definitions Task Force of the American Academy of Sleep Medicine. J Clin Sleep Med. 2012 Oct 15;8(5):597-619. [CrossRef] [PubMed]
- Gottlieb DJ, Yenokyan G, Newman AB, O'Connor GT, Punjabi NM, Quan SF, Redline S, Resnick HE, Tong EK, Diener-West M, Shahar E. Prospective study of obstructive sleep apnea and incident coronary heart disease and heart failure: the sleep heart health study. Circulation. 2010 Jul 27;122(4):352-60. [CrossRef] [PubMed]
- Marin JM, Carrizo SJ, Vicente E, Agusti AG. Long-term cardiovascular outcomes in men with obstructive sleep apnoea-hypopnoea with or without treatment with continuous positive airway pressure: an observational study. Lancet. 2005 Mar 19-25;365(9464):1046-53. [CrossRef] [PubMed]
- Peppard PE, Young T, Palta M, Skatrud J. Prospective study of the association between sleep-disordered breathing and hypertension. N Engl J Med. 2000 May 11;342(19):1378-84. [CrossRef] [PubMed]
- Quan SF, Howard BV, Iber C, et al. The Sleep Heart Health Study: design, rationale, and methods. Sleep. 1997 Dec;20(12):1077-85. [PubMed]
- Lind BK, Goodwin JL, Hill JG, Ali T, Redline S, Quan SF. Recruitment of healthy adults into a study of overnight sleep monitoring in the home: experience of the Sleep Heart Health Study. Sleep Breath. 2003 Mar;7(1):13-24. [CrossRef] [PubMed]
- Nieto FJ, Young TB, Lind BK, Shahar E, Samet JM, Redline S, D'Agostino RB, Newman AB, Lebowitz MD, Pickering TG. Association of sleep-disordered breathing, sleep apnea, and hypertension in a large community-based study. Sleep Heart Health Study. JAMA. 2000 Apr 12;283(14):1829-36. [CrossRef] [PubMed]
- Redline S, Sanders MH, Lind BK, Quan SF, Iber C, Gottlieb DJ, Bonekat WH, Rapoport DM, Smith PL, Kiley JP. Methods for obtaining and analyzing unattended polysomnography data for a multicenter study. Sleep Heart Health Research Group. Sleep. 1998 Nov 1;21(7):759-67. [PubMed]
- O'Connor GT, Caffo B, Newman AB, Quan SF, Rapoport DM, Redline S, Resnick HE, Samet J, Shahar E. Prospective study of sleep-disordered breathing and hypertension: the Sleep Heart Health Study. Am J Respir Crit Care Med. 2009 Jun 15;179(12):1159-64. [CrossRef] [PubMed]
- Whitney CW, Gottlieb DJ, Redline S, Norman RG, Dodge RR, Shahar E, Surovec S, Nieto FJ. Reliability of scoring respiratory disturbance indices and sleep staging. Sleep. 1998 Nov 1;21(7):749-57. [CrossRef] [PubMed]
- Rechtschaffen A. A manual for standardized terminology, techniques and scoring system for sleep stages in human subjects. Brain information service. Washington, DC : United States Government Printing Office, 1968.
- Martínez-García MA, Campos-Rodríguez F, Catalán-Serra P, Soler-Cataluña JJ, Almeida-Gonzalez C, De la Cruz Morón I, Durán-Cantolla J, Montserrat JM. Cardiovascular mortality in obstructive sleep apnea in the elderly: role of long-term continuous positive airway pressure treatment: a prospective observational study. Am J Respir Crit Care Med. 2012 Nov 1;186(9):909-16. [CrossRef] [PubMed]
- Gami AS, Olson EJ, Shen WK, Wright RS, Ballman KV, Hodge DO, Herges RM, Howard DE, Somers VK. Obstructive sleep apnea and the risk of sudden cardiac death: a longitudinal study of 10,701 adults. J Am Coll Cardiol. 2013 Aug 13;62(7):610-6. [CrossRef] [PubMed]
- Butler MP, Emch JT, Rueschman M, Sands SA, Shea SA, Wellman A, Redline S. Apnea-Hypopnea Event Duration Predicts Mortality in Men and Women in the Sleep Heart Health Study. Am J Respir Crit Care Med. 2019 Apr 1;199(7):903-912. [CrossRef] [PubMed]
- Azarbarzin A, Sands SA, Stone KL, et al. The hypoxic burden of sleep apnoea predicts cardiovascular disease-related mortality: the Osteoporotic Fractures in Men Study and the Sleep Heart Health Study. Eur Heart J. 2019 Apr 7;40(14):1149-1157. [CrossRef] [PubMed]
- Budhiraja R, Javaheri S, Parthasarathy S, Berry RB, Quan SF. The Association Between Obstructive Sleep Apnea Characterized by a Minimum 3 Percent Oxygen Desaturation or Arousal Hypopnea Definition and Hypertension. J Clin Sleep Med. 2019 Sep 15;15(9):1261-1270. [CrossRef] [PubMed]
- Budhiraja R, Javaheri S, Parthasarathy S, Berry RB, Quan SF. Incidence of hypertension in obstructive sleep apnea using hypopneas defined by 3 percent oxygen desaturation or arousal but not by only 4 percent oxygen desaturation. J Clin Sleep Med. 2020 Oct 15;16(10):1753-1760. [CrossRef] [PubMed]
- Quan SF, Budhiraja R, Javaheri S, Parthasarathy S, Berry RB. The association between obstructive sleep apnea defined by 3 percent oxygen desaturation or arousal definition and self-reported cardiovascular disease in the Sleep Heart Health Study. Southwest J Pulm Crit Care. 2020;21(4):86-103. [CrossRef]
Abbreviations
- AASM American Academy of Sleep Medicine
- AHI Apnea hypopnea index
- AHI3%A Apnea hypopnea index defined using a hypopnea definition requiring a minimum 3% O2 desaturation or arousal
- AHI4% Apnea hypopnea index defined using a hypopnea definition requiring a minimum 4% O2 desaturation
- BMI Body mass index
- CMS Centers for Medicare and Medicaid Services
- CVD Cardiovascular disease
- HDL High density lipoprotein
- HR Hazard ratio
- OSA Obstructive sleep apnea
- SHHS Sleep Heart Health Study
Acknowledgements
The Sleep Heart Health Study was supported by National Heart, Lung and Blood Institute cooperative agreements U01HL53940 (University of Washington), U01HL53941 (Boston University), U01HL53938 (University of Arizona), U01HL53916 (University of California, Davis), U01HL53934 (University of Minnesota), U01HL53931 (New York University), U01HL53937 and U01HL64360 (Johns Hopkins University), U01HL63463 (Case Western Reserve University), and U01HL63429 (Missouri Breaks Research). A list of SHHS investigators, staff and their participating institutions is available on the SHHS website, http://jhuccs1.us/shhs/details/investigators.htm.
Cite as: Budhiraja R, Quan SF. Long-term all-cause mortality risk in obstructive sleep apnea using hypopneas defined by a ≥3 percent oxygen desaturation or arousal. Southwest J Pulm Crit Care. 2021;23(1):23-35. doi: https://doi.org/10.13175/swjpcc025-21 PDF
The Association Between Obstructive Sleep Apnea Defined by 3 Percent Oxygen Desaturation or Arousal Definition and Self-Reported Cardiovascular Disease in the Sleep Heart Health Study
Stuart F. Quan, M.D.1,2
Rohit Budhiraja, M.D.1
Sogol Javaheri, M.A., M.D., M.P.H.1
Sairam Parthasarathy, M.D.2
Richard B. Berry, M.D.3
1Division of Sleep and Circadian Disorders, Brigham and Women’s Hospital, Harvard Medical School, Boston, MA; 2Department of Medicine, University of Arizona College of Medicine, Tucson, AZ; 3Division of Pulmonary, Critical Care, and Sleep Medicine, University of Florida, Gainesville, FL
Editor's Note: Click here to see an accompanying editorial.
Abstract
Background: Studies have established that OSA defined using a hypopnea definition requiring a >4% oxygen desaturation (AHI4%) is associated with cardiovascular (CVD) or coronary heart (CHD) disease. This study determined whether OSA defined using a hypopnea definition characterized by a >3% oxygen desaturation or an arousal (AHI3%A) is associated with CVD/CHD.
Methods: Data were analyzed from 6307 Sleep Heart Health Study participants who had polysomnography. Self-reported CVD included angina, heart attack, heart failure, stroke or previous coronary bypass surgery or angioplasty. Self-reported CHD included the aforementioned conditions but not stroke or heart failure. The association between OSA and CVD/CHD was examined using logistic regression models with stepwise inclusion of demographic, anthropometric, social/behavioral and co-morbid medical conditions. A parsimonious model in which diabetes and hypertension were excluded because of their potential to be on the causal pathway between OSA and CVD/CHD also was constructed.
Results: For CVD, the odds ratios and 95% confidence intervals for AHI3%A >30/hour were 1.39 (1.03-1.87) and 1.45 (1.09-1.94) in the fully adjusted and parsimonious models. Results for CHD were 1.29 (0.96-1.74) and 1.36 (0.99-1.85). In participants without OSA according to more stringent AHI4% criteria but with OSA using the AHI3%A definition, similar findings were observed.
Conclusion: OSA defined using an AHI3%A is associated with both CVD and CHD. Use of a more restrictive AHI4% definition will misidentify a large number of individuals with OSA who have CVD or CHD. These individuals may be denied access to therapy, potentially worsening their underlying CVD or CHD.
Introduction
Obstructive sleep apnea (OSA) is a common disorder characterized by recurrent episodes of either complete upper airway collapse (apneas) or partial collapse (hypopneas) during sleep. A number of large studies have established that OSA is a risk factor for the development of hypertension and cardiovascular disease (CVD) as well as higher mortality; individuals with more severe OSA are at greater risk (1-3). The most commonly used metric of OSA severity is the apnea hypopnea index (AHI). However, there is controversy regarding the definition of the AHI. In 2012, the American Academy of Sleep Medicine (AASM) recommended that the hypopnea definition include any decrease in airflow by at least 30% from the baseline with an oxyhemoglobin desaturation of at least 3%, or an arousal from sleep (4). However, several payors including the Centers for Medicare and Medicaid Services (CMS) continue to require a more stringent hypopnea definition necessitating a 4% or greater decrease in oxygen saturation (5) despite evidence documenting a relationship between the AASM recommended standard and daytime sleepiness (6). The resistance to universal acceptance of the AASM criteria is based in part on the lack of evidence that 3% desaturations or arousals have an adverse cardiovascular impact. This reluctance to adopt a more inclusive definition of sleep apnea has restricted access to OSA treatment for many patients (7). Therefore, determining if there is relationship between OSA characterized by at least 3% drop in saturation or an arousal from sleep and CVD may assist in identification of persons at risk for CVD, allow greater access to care and potentially improve other health-related outcomes.
Using the database from the Sleep Heart Health Study, a large well-characterized community based cohort that had undergone polysomnography, the current study aimed to determine the association between the AASM recommended definition of the AHI which incorporates hypopneas with at least a 3% desaturation or an arousal (AHI3%A) and self-reported CVD and coronary heart disease (CHD) in middle-aged and older adults. In addition, we sought to ascertain whether there was an association between CVD or CHD and OSA severity among individuals who were not identified as having OSA using the more restrictive standard of requiring at least a 4% oxygen desaturation irrespective of an arousal (AHI4%), but were classified as having OSA by the AHI3%A definition. We hypothesized that increasing OSA severity represented by the AHI3%A would be associated with a greater likelihood of having prevalent CVD or CHD, and that persons who were not identified as having OSA using the AHI4% criteria would have a higher likelihood as well.
Methods
This study analyzed data obtained from the Sleep Heart Health Study (SHHS) which was a prospective multicenter cohort study designed to investigate the relationship between OSA and cardiovascular diseases in the United States. The study’s rationale and design have been published elsewhere (8). Briefly, 6,441 subjects, 40 years of age and older were recruited starting in 1995 from several ongoing “parent” cardiovascular and respiratory disease cohorts that were initially assembled between 1976 and 1995 (9). These cohorts included the Offspring Cohort and the Omni Cohort of the Framingham Heart Study in Massachusetts; the Hagerstown, MD, and Minneapolis, MN, sites of the Atherosclerosis Risk in Communities Study; the Hagerstown, MD, Pittsburgh, PA, and Sacramento, CA, sites of the Cardiovascular Health Study; 3 hypertension cohorts (Clinic, Worksite, and Menopause) in New York City; the Tucson Epidemiologic Study of Airways Obstructive Diseases and the Health and Environment Study; and the Strong Heart Study of American Indians in Oklahoma, Arizona, North Dakota, and South Dakota. Because of sovereignty issues, 134 participants from the Arizona cohort of the Strong Heart Study withdrew consent. Analyses were performed on the remaining 6307 participants. The SHHS was approved by each site’s institutional review board for human subjects’ research, and informed written consent was obtained from all subjects at the time of their enrollment.
Polysomnography and Home Visit
Participants underwent overnight in-home polysomnograms using the Compumedics Portable PS-2 System (Abbottsville, Victoria, Australia) administered by trained technicians (10). The home visits were performed by two-person, mixed-sex teams in visits that lasted 1.5 to 2 hours. Participants were asked to schedule the visit so that it would occur approximately two hours prior to their usual bedtime. At the time of the home visit, an inventory of each participant’s medications was made. In addition, a health interview was completed that ascertained the presence of several health conditions. Questionnaires that were completed included the SHHS Sleep Habits Questionnaire which incorporated the Epworth Sleepiness Scale (ESS) (11) and the Medical Outcomes Study SF-36 (12). Blood pressure was measured manually in triplicate in a seated position after 5 minutes of rest (13). The average of the second and third measurements was used for this analysis. Body weight was obtained using a digital scale.
The SHHS recording montage consisted of electroencephalogram (C4/A1 and C3/A2), right and left electrooculogram, a bipolar submental electromyogram, thoracic and abdominal excursions (inductive plethysmography bands), airflow (detected by a nasal-oral thermocouple (Protec, Woodinville, WA), oximetry (finger pulse oximetry [Nonin, Minneapolis, MN]), electrocardiogram and heart rate (using a bipolar electrocardiogram lead), body position (using a mercury gauge sensor), and ambient light (on/off, by a light sensor secured to the recording garment). Sensors were placed, and equipment was calibrated during an evening home visit by a certified technician. After technicians retrieved the equipment, the data, stored in real time on PCMCIA cards, were downloaded to the computers of each respective clinical site, locally reviewed, and forwarded to a central reading center (Case Western Reserve University, Cleveland, OH). Comprehensive descriptions of polysomnography scoring and quality-assurance procedures have been previously published (14). In brief, sleep was scored according to guidelines developed by Rechtschaffen and Kales (15). Strict protocols were maintained to ensure comparability among centers and technicians. Intra-scorer and inter-scorer reliabilities were high (14).
The apnea hypopnea index (AHI) was calculated for each participant using two definitions of hypopnea, the AASM recommended definition [AHI3%A] and the AASM acceptable [CMS] definition [AHI4%]. For AHI3%A, hypopneas were identified if the amplitude of a measure of flow or volume (detected by the thermocouple or thorax or abdominal inductance band signals) was reduced discernibly (at least 30% lower than baseline breathing) for at least 10 seconds, did not meet the criteria for apnea and the event was associated with either a 3% oxygen desaturation from baseline or terminated with electroencephalographic evidence of an arousal. For AHI4%, hypopneas were identified if the aforementioned reduction in flow or volume occurred and the event was associated with a 4% oxygen desaturation from baseline. In both cases, an apnea was defined as a complete or almost complete cessation of airflow, as measured by the amplitude of the thermocouple signal, lasting at least 10 seconds.
Outcome Assessment
Self-reported CVD and CHD were the outcomes of interest for this analysis and were obtained from the standardized health interview performed at the time of each participant’s polysomnography home visit. Participants were asked if they had ever been told by a doctor that she or he had angina, heart attack, heart failure, or stroke and if the participant had ever undergone coronary bypass surgery or coronary angioplasty. Prevalent CVD was defined as a positive response to one or more of the aforementioned conditions or procedures. Prevalent CHD was defined as an affirmative response to the same questions with the exclusion of responses to the presence of heart failure or stroke.
Covariates
Selection of potential covariates was based on previous studies documenting an association with either CVD or CHD. These included various demographic (e.g., sex, race/ethnicity, education, marital status), anthropometric (e.g., height, weight and blood pressure [BP]), social/behavioral (e.g., smoking history, alcohol use, sleep duration, quality of life) indices as well as plasma lipids (cholesterol, high density lipoprotein [HDL], triglycerides), several diseases (depression, hypertension, diabetes) and spirometry.
The following definitions were used for those covariates that were not primarily recorded. Body mass index (BMI) was calculated as weight (kg)/height (m2). The ankle arm index (AAI) was computed as the ratio of blood pressure at the ankle to that in the arm. Waist to hip ratio was the waist divided by hip circumferences. Hypertension was defined as a self-report of hypertension or the use of anti-hypertensive medications. Diabetes was considered present if it was self-reported by the participant or if there was use of oral hypoglycemic agents or insulin. Depression was defined as present if the participant indicated on the SF-36 that he/she was feeling “blue” or “down” for at least “a good bit of the time” for the previous 4 weeks, or he/she was using antidepressant medications. Insomnia was defined as often or almost always having “trouble falling asleep”, “waking up during the middle of the night and having difficulty getting back to sleep” or “waking up too early in the morning and being unable to get back to sleep”. Sleepiness was assessed by the ESS as well as by self-report of being excessively sleepy during the day most or almost all of the time.
Statistical Analyses
Mean and standard deviation, and percentages were used to provide an overall description of the data used in the analyses. Unadjusted differences were compared using Student’s t test or c2. For both definitions of the AHI, each participant’s AHI was assigned to one of 4 OSA severity categories: Normal (AHI <5 /hour), Mild (AHI ≥5 and <15 /hour), Moderate (AHI ≥15 and < 30/hour) and Severe (AHI ≥30/hour).
Missing data was present in 4.8% of observations and were felt to be missing at random. Inasmuch as using a “complete case analysis” would result in exclusion of a significant number of participants from our analyses with a consequent reduction in statistical power, multiple imputation using the multiple imputation by chained equation (MICE) package in R was employed to generate replacement values. Comparison of the imputed to the original dataset did not identify any outliers in the imputed dataset and means of the same variables between datasets were comparable.
To reduce the number of relevant predictors, overfitting of models, reduce potential collinearity and minimize prediction error, a Least Absolute Shrinkage and Selection Operator (lasso) regression was performed for both outcome variables using the glmnet package in R. This resulted in an analytic dataset for CVD that consisted of the following: age, sex, race/ethnicity, BMI, AAI, diastolic BP, smoking, SF-36 physical component summary (PCS), SF-36 general health rating (GenHlth), SF-36 ability to perform vigorous activity (VigActiv), hypertension, diabetes, depression and HDL. For CHD, the analytic dataset consisted of the following: age, sex, race/ethnicity, BMI, diastolic BP, smoking, PCS, GenHlth, VigActiv, hypertension, diabetes, triglycerides and HDL.
For the entire cohort, logistic regression using SPSS v27 (Armonk, NY) was used to generate increasingly complex models of the relationship between either CVD or CHD and severity of OSA adjusting for the covariates identified using the lasso regression. For CVD, after the unadjusted model, models were generated for the sequential addition of demographic factors (age, sex, race/ethnicity), anthropometric factors (BMI, AAI, diastolic BP), social/behavioral characteristics (smoking, PCS, GenHlth, VigActiv) and diseases/conditions (hypertension, diabetes, depression, HDL). For CHD after the unadjusted model, the corresponding sequential models were demographic factors (age, sex, race/ethnicity), anthropometric factors (BMI, diastolic BP), social/behavioral characteristics (smoking, PCS, GenHlth, VigActiv) and diseases/conditions (hypertension, diabetes, triglycerides, HDL). Because of the possibility that adjustment for a hypertension and a diabetes indicator would be “overadjustment” (i.e., adjustment for a variable on a causal pathway), we excluded both hypertension and diabetes from the final set of covariates in additional analyses and these are referred to as “parsimonious models.” Lastly, sensitivity analyses were performed in which the natural log of AHI3%A was used instead of categorial levels of that factor in the above models.
Associations between both CVD and CHD, and OSA severity were further analyzed in the subgroup of participants who were not classified as having OSA based on AHI4% criteria but were classified as OSA using AHI3%A criteria. The moderate and severe categories were combined because of the small number of cases in the severe OSA category. Otherwise, the modelling approaches employed were identical.
In Tables 2-5, odds ratios and 95% CI are presented versus the reference level of AHI <5 /hour. P values refer to the overall significance of the model with respect to OSA severity. Odds ratios, 95% CI and P values in Table 6 refer to AHI3%A expressed as the continuous factor lnAHI3%A+0.1 (0.1 added to mitigate 0 values of lnAHI3%A).
Results
Table 1 shows the univariate association of potential risk factors or characteristics with the presence of CVD or CHD.
Table 1. Univariate Association of Various Characteristics to Prevalent Cardiovascular (CVD) and Coronary Heart Disease (CHD)

N=6307 for all characteristics except AHI 3%/A (N=6131)
ap≤0.05; bp≤0.01; cp≤0.001
There were 962 cases (15%) of CVD and 797 (13%) cases of CHD identified. Except for total cholesterol, all were either more prevalent or significantly higher or lower in participants with CVD or CHD. For both CVD and CHD, markedly higher prevalence rates were noted for sex (higher in men), hypertension, diabetes, depression, smoking (higher in ever smokers) and ability to engage in vigorous activity. Conversely, white race and good health status were much less common among those with CVD or CHD. Differences observed for the remaining characteristics were of lesser magnitude.
Figure 1 shows the prevalence rates of CVD or CHD as a function of OSA severity using the AHI3%A criteria. Both conditions were associated with increasing higher rates of disease as OSA became more severe.

Figure 1. Percentage of participants with either cardiovascular (CVD) or coronary heart (CHD) disease according to increasing severity of obstructive sleep apnea defined using a hypopnea definition characterized by a minimum 3% oxygen desaturation or an arousal (AHI3%A)
Table 2 shows the crude and adjusted odds ratios and their 95% confidence intervals for increasing complex models of the relationship between CVD and AHI3%A. The unadjusted model showed a strong, progressive association with increasingly severe OSA. However, as the models became increasingly complex, this relationship was attenuated and only approached statistical significance in the fully adjusted model (+Medical Conditions). Removal of hypertension and diabetes to create the Parsimonious model restored some of the association with a return of statistical significance.
Table 2. Adjusted Relative Odds (95% Confidence Interval) of Self-Reported Prevalent Cardiovascular Disease According to 3% or Arousal Apnea Hypopnea Index Severity Categories

aDemographics model adds age, sex, race (White vs. American Indian)
bAnthropometrics model adds BMI, Ankle Arm Index, diastolic blood pressure
cSocial/Behavioral Factors model adds smoking, SF36 Physical Component Summary, SF36 General Health, SF36 Vigorous Activity
dMedical Conditions model adds hypertension, diabetes, depression and HDL
eParsimonious model includes factors in previous models, but removes hypertension and diabetes
fN=6307
Presented in Table 3 are the models demonstrating the relationship between CHD and AHI3%A.
Table 3. Adjusted Relative Odds (95% Confidence Interval) of Self-Reported Prevalent Coronary Heart Disease According to 3% or Arousal Apnea Hypopnea Index Severity Categoriesf

aDemographics model adds age, sex, race (White vs. American Indian)
bAnthropometrics model adds BMI, diastolic blood pressure
cSocial/Behavioral Factors model adds smoking, SF36 Physical Component Summary, SF36 General Health, SF36 Vigorous Activity
dMedical Conditions model adds hypertension, diabetes, triglycerides and HDL
eParsimonious model includes factors in previous models, but removes hypertension and diabetes
fN=6307
Similar to the findings for CVD, there was a progressively higher odds of having CHD as severity of OSA increased. The fully adjusted model (+Medical Conditions) was not significant, but the Parsimonious model approached statistical significance.
There were 3,326 participants who did not have OSA as defined by AHI4% criteria. Within this cohort, 2247 were classified as OSA using the AHI3%A criteria; 1966 (87.4%) were mild, 271 (12.0%) were moderate and 10 (0.4%) were severe. For this subgroup, Table 4 presents the increasingly complex models illustrating the relationship between the presence of CVD and increasing OSA severity.
Table 4. Adjusted Relative Odds (95% Confidence Interval) of Self-Reported Prevalent Cardiovascular Disease According to 3% or Arousal Apnea Hypopnea Index Severity Categories in Participants Without Obstructive Sleep Apnea According to 4% Desaturation Criteriaf

aDemographics model adds age, sex, race (White vs. American Indian)
bAnthropometrics model adds BMI, Ankle Arm Index, diastolic blood pressure
cSocial/Behavioral Factors model adds smoking, SF36 Physical Component Summary, SF36 General Health, SF36 Vigorous Activity
dMedical Conditions model adds hypertension, diabetes, depression and HDL
eParsimonious model includes factors in previous models, but removes hypertension and diabetes
fN=3326
Because of the relatively small number of cases with severe OSA, the moderate and severe cases were combined for these analyses. The unadjusted model showed a strong relationship with OSA severity; as model complexity increased, this finding was attenuated and only approached statistical significance in both the fully adjusted (+Medical Conditions) and Parsimonious models. As demonstrated in Table 5, similar findings were observed for CHD; the unadjusted model showed a strong association which was attenuated as the models became more complex; the fully adjusted (+medical conditions) and parsimonious models approached statistical significance.
Table 5. Adjusted Relative Odds (95% Confidence Interval) of Self-Reported Prevalent Coronary Heart Disease According to 3% or Arousal Apnea Hypopnea Index Severity Categories in Participants Without Obstructive Sleep Apnea According to 4% Desaturation Criterionf

aDemographics model adds age, sex, race (White vs. American Indian)
bAnthropometrics model adds BMI, diastolic blood pressure
cSocial/Behavioral Factors model adds smoking, SF36 Physical Component Summary, SF36 General Health, SF36 Vigorous Activity
dMedical Conditions model adds hypertension, diabetes, triglycerides and HDL
eParsimonious model includes factors in previous models, but removes hypertension and diabetes
fN=3326
In sensitivity analyses, the natural log of AHI3%A was used as the index of OSA severity in lieu of a categorial representation. As shown in Table 6, in the entire cohort, for both CVD and CHD, a significant linear relationship with increasing severity of OSA was demonstrated in parsimonious models, but not the fully adjusted models. In the subgroup who did not have OSA as defined by AHI4% criteria but did have OSA using the AHI3%A criteria, linear relationships noted for both CVD and CHD in the fully adjusted and parsimonious models. For CHD in the fully adjusted model, the relationship was statistically significant and approached statistical significance in the others.
Table 6. Linear Adjusted Relative Odds (95% Confidence Interval) of Self-Reported Prevalent Cardiovascular and Coronary Heart Disease According to 3% or Arousal Apnea Hypopnea Index Severity

aCohort restricted participants without OSA according to AHI4% criteria, N=3326
bCovariates for CVD: age, sex, race, BMI, ankle-arm index, diastolic blood pressure
smoking, SF36 Physical Component Summary, SF36 General Health, SF36 Vigorous Activity
hypertension, diabetes, depression and HDL; Covariates for CHD: age, sex, race, BMI, diastolic blood pressure,smoking, SF36 Physical Component Summary, SF36 General Health, SF36 Vigorous Activity, hypertension, diabetes, triglycerides and HDL
cExcludes diabetes and hypertension from fully adjusted model
Discussion
In this large community-based study, we demonstrated that OSA defined by apneas and hypopneas characterized by 3% desaturation events or arousals is associated with an increased likelihood of self-reported CVD and CHD after controlling for a number of relevant covariates. Importantly, in a subset of this cohort who did not have OSA as defined by apneas and hypopneas requiring a minimum 4% oxygen desaturation but did have OSA using the 3% desaturation or arousal criteria, we found that the association with both CVD and CHD remained, albeit weaker. Nevertheless, our analyses overall suggest that the regulatory requirement by the Centers for Medicare and Medicaid Services (CMS) in the United States of using a 4% desaturation definition to identify patients with OSA denies a substantial proportion of these individuals the opportunity to be treated for their OSA and thus reduce the risk of worsening or recurrence of their CVD or CHD.
Results from several large cohort studies including SHHS have found that OSA is associated with the presence of CVD and CHD, and that this association is stronger when the AHI as a metric of OSA severity increases (1, 2). These previous studies have used a definition of hypopnea that requires a minimum 4% oxygen desaturation (16-18). This definition has been adopted by CMS and other insurers to identify individuals as having OSA (5). However, the AASM recommends defining hypopneas with a minimum 3% desaturation or an arousal (4). This is based on evidence indicating that daytime sleepiness and other symptoms of OSA are associated with this less stringent definition of OSA (6). This distinction has important clinical implications because there are a large number of patients who do not meet the AHI4% criteria and but do meet the AHI3%A criteria (7, 19). In the former case, they are not considered to have OSA, but do have it in the latter.
To our knowledge, our study is the first to assess the association between OSA using the AHI3%A criteria and CVD and CHD. We found that as OSA severity increased, there was a greater likelihood of having CVD and CHD after adjusting for a number of relevant covariates. We acknowledge that in the fully adjusted model, this association only approached statistical significance. However, in our parsimonious model which removed the presence of hypertension and diabetes, likely mediators of this relationship, the association was strengthened. Sensitivity analyses using the natural log of AHI3%A validated the results we observed with categories of AHI severity. It has been well-established that hypertension and diabetes are independent risk factors for the development of CVD and CHD. However, a number of studies have demonstrated that OSA is a risk factor for the development of both hypertension and diabetes (1, 20). Therefore, both of the latter conditions lie on the causal path by which OSA may increase the risk for the development of CVD and CHD. Hence, we believe that inclusion of both these conditions in our fully adjusted model may be over-adjustment and that our parsimonious model best represents the association between OSA defined by AHI3%A and CVD or CHD.
We identified there was a large subset of our cohort that had OSA using the AHI3%A definition, but not the AHI4% definition of hypopnea. In this subset, we also observed an association between OSA severity and both CVD and CHD. This finding is analogous to the relationship we recently observed between OSA and the prevalence of hypertension (19). Similar to our findings with the full cohort, the fully adjusted model for both CVD and CHD was not statistically significant. However, it approached or became statistically significant in the parsimonious models. Although most of these cases were in the mild OSA category, 12.4% were moderate to severe where treatment is almost always recommended. Individuals with prevalent CVD or CHD and OSA are at risk for further complications of their CVD or CHD (21-23). However, if they do not meet the AHI4% definition of OSA, access to OSA treatment would be denied by CMS and some insurers.
Our findings with respect to CVD and CHD are consistent with recent analyses demonstrating that OSA defined by AHI3%A is associated with prevalent and incident hypertension in the SHHS cohort (19, 24). Similar findings also have been observed in other cohorts providing additional evidence that use of a hypopnea definition incorporating a minimum 3% oxygen desaturation or an arousal is important in the identification of individuals with OSA (25-27).
Although there is substantial evidence emerging that intermittent hypoxemia plays an important role in the cardiovascular consequences of OSA (28), the importance of arousals remains uncertain (29). Arousals involve an increase in the sympathetic activity and a decrease in the parasympathetic activity (28) and there is some evidence linking them in the development of hypertension (30). Data from our study would suggest that they may contribute to the development of CVD or CHD as well.
Some (31, 32), but not all (33) studies have suggested that the impact of OSA on the development of CVD or CHD is in part enhanced by the presence of sleepiness. However, in our initial assessment of potential covariates using a lasso regression, sleepiness did not emerge as a significant factor. Thus, our findings do not support the contention that sleepiness is an important factor impacting the relationship between OSA and CVD or CHD.
Our study does have a few limitations. Most important is that we identified prevalent CVD and CHD by self-report. While it is possible that some misclassification occurred, we do not think it was large. A large number of potential covariates were considered for inclusion in the models; we used a lasso regression to reduce the possibility of over-adjustment and collinearity. Furthermore, the possibility of residual confounding remains. Finally, this is a cross-sectional analysis, and causality cannot be assumed.
This study has several strengths. It uses a large, well characterized cohort with the availability of data from a number of potential covariates. Additionally, the cohort had a diverse racial/ethnic, age and sex distribution. Polysomnography was used to document the presence of OSA, and not more limited sleep apnea testing.
In summary, OSA as defined by apneas and hypopneas requiring a minimum 3% oxygen desaturation or arousal is associated with an increased likelihood of having CVD or CHD. Use of a more restrictive definition requiring a minimum 4% desaturation will misidentify a large number of individuals with OSA, and CVD or CHD. These individuals may be denied access to therapy which may prevent worsening of their underlying CVD or CHD.
Acknowledgements
SHHS acknowledges the Atherosclerosis Risk in Communities Study, the Cardiovascular Health Study, the Framingham Heart Study, the Cornell/Mt. Sinai Worksite and Hypertension Studies, the Strong Heart Study, the Tucson Epidemiologic Study of Airways Obstructive Diseases (TESAOD), and the Tucson Health and Environment Study for allowing their cohort members to be part of the SHHS and for sharing such data for the purposes of this study. SHHS is particularly grateful to the members of these cohorts who agreed to participate in SHHS as well. SHHS further recognizes all the investigators and staff who have contributed to its success. A list of SHHS investigators, staff, and their participating institutions is available on the SHHS website (www.jhsph.edu/shhs).
The opinions expressed in this paper are those of the authors and do not necessarily reflect the views of the Indian Health Service.
This work was supported by National Heart, Lung and Blood Institute cooperative agreements U01HL53940 (University of Washington), U01HL53941 (Boston University), U01HL53938 (University of Arizona), U01HL53916 (University of California, Davis), U01HL53934 (University of Minnesota), U01HL53931 (New York University), U01HL53937 and U01HL64360 (Johns Hopkins University), U01HL63463 (Case Western Reserve University), U01HL63429 (Missouri Breaks Research).
SP was supported by Patient Centered Outcomes Research Institute (CER-2018C2-13262; PCS-1504-30430; DI-2018C2-13161; DI-2018C2-13161 COVID supplement, EADI-16493), NIH (HL126140, HL151254, AI135108, AG059202, HL158253) and American Academy of Sleep Medicine Foundation during the writing of this manuscript.
Authors’ Declarations: Dr. Budhiraja reports no conflicts of interest or grant funding. Dr. Quan reports research funding from the National Institutes of Health, serves as a consultant to Jazz Pharmaceuticals, Whispersom and is a committee chair and hypopnea taskforce member for the American Academy of Sleep Medicine. Dr. Javaheri serves as a consultant for Jazz Pharmaceuticals and Harmony Biosciences. Dr. Berry reports research funding from Philips Respironics, Res Med and the University of Florida Foundation. Dr. Parthasarathy reports grants from NIH/NHLBI as PI (HL138377, HL126140; IPA-014264-00001; HL095799) or site PI (HL128954; UG3HL140144), grants from Patient Centered Outcomes Research Institute as PI (IHS-1306-02505; EAIN-3394-UOA) or site-investigator (PCS-1504-30430), grants from US Department of Defense as co-investigator (W81XWH-14-1-0570), grants from NIH/NCI as co-investigator (R21CA184920) and NIH/NIMHD as co-investigator (MD011600), grants from Johrei Institute, personal fees from American Academy of Sleep Medicine, non-financial support from National Center for Sleep Disorders Research of the NIH (NHLBI), personal fees from UpToDate Inc., grants from Younes Sleep Technologies, Ltd., personal fees from Vapotherm, Inc., personal fees from Merck, Inc., grants from Philips-Respironics, Inc., personal fees from Philips-Respironics, Inc., personal fees from Bayer, Inc., personal fees from Nightbalance, Inc, personal fees from Merck, Inc, grants from American Academy of Sleep Medicine Foundation (169-SR-17); In addition, Dr. Parthasarathy has a patent UA 14-018 U.S.S.N. 61/884,654; PTAS 502570970 (Home breathing device) issued.
A preprint of this paper is available at: medRxiv, https://doi.org/10.1101/2020.09.22.20199745
Abbreviation List
AHI Apnea Hypopnea Index
AHI3%A Hypopneas with at least a 3% oxygen desaturation or an arousal
AHI4% Hypopneas with at least a 4% oxygen desaturation
AAI Ankle arm index
BP Blood pressure
BMI Body mass index
CHD Coronary heart disease
CVD Cardiovascular disease
CMS Centers for Medicare and Medicaid Services
ESS Epworth sleepiness scale
GenHlth General health rating subscale of SF36
Glmnet A statistical package used in R that fits a generalized linear model via penalized maximum likelihood
HDL High density lipoprotein
Lasso Least Absolute Shrinkage and Selection Operator
MICE Multiple imputation by chained equation
OSA Obstructive sleep apnea
PCS Physical component summary of the SF36
R An open source programming language used for statistical computing and graphics
SHHS Sleep Heart Health Study
VigActiv Vigorous activity rating subscale of the SF36
References
- Hou H, Zhao Y, Yu W, Dong H, Xue X, Ding J, Xing W, Wang W. Association of obstructive sleep apnea with hypertension: A systematic review and meta-analysis. J Glob Health. 2018 Jun;8(1):010405. [CrossRef] [PubMed]
- Mashaqi S, Gozal D. The impact of obstructive sleep apnea and PAP therapy on all-cause and cardiovascular mortality based on age and gender - a literature review. Respir Investig. 2020 Jan;58(1):7-20. [CrossRef] [PubMed]
- Berry RB, Budhiraja R, Gottlieb DJ, et al. Rules for scoring respiratory events in sleep: update of the 2007 AASM Manual for the Scoring of Sleep and Associated Events. Deliberations of the Sleep Apnea Definitions Task Force of the American Academy of Sleep Medicine. J Clin Sleep Med. 2012;8(5):597-619. [CrossRef] [PubMed]
- Anonymous. CPAP for Obstructive Sleep Apnea. Last Updated: 2020. Accessed: 09/14, 2020. https://www.cms.gov/Medicare/Coverage/Coverage-with-Evidence-Development/CPAP.
- Shamin-Uzzaman QA, Singh S, Chowdhuri S. Hypopnea definitions, determinants, and dilemmas: a focused review. Sci Sleep Pract. 2018;2(1):7. [CrossRef]
- Raj R, Hirshkowitz M. Effect of the new Medicare guideline on patient qualification for positive airway pressure therapy. Sleep Med. 2003 Jan;4(1):29-33.
- [CrossRef] [PubMed]
- Quan SF, Howard BV, Iber C, Kiley JP, Nieto FJ, O'Connor GT, Rapoport DM, Redline S, Robbins J, Samet JM, Wahl PW. The Sleep Heart Health Study: design, rationale, and methods. Sleep. 1997 Dec;20(12):1077-85. [PubMed]
- Lind BK, Goodwin JL, Hill JG, Ali T, Redline S, Quan SF. Recruitment of healthy adults into a study of overnight sleep monitoring in the home: experience of the Sleep Heart Health Study. Sleep Breath. 2003;7(1):13-24. [CrossRef] [PubMed]
- Iber C, Redline S, Kaplan Gilpin AM, et al. Polysomnography performed in the unattended home versus the attended laboratory setting--Sleep Heart Health Study methodology. Sleep. 2004;27(3):536-540. HTTPS://PUBMED.NCBI.NLM.NIH.GOV/ 15164911 [CrossRef] [PubMed]
- Johns MW. A new method for measuring daytime sleepiness: the Epworth sleepiness scale. Sleep. 1991;14(6):540-545. [CrossRef] [PubMed]
- Ware JE,Jr, Sherbourne CD. The MOS 36-item short-form health survey (SF-36). I. Conceptual framework and item selection. Med Care. 1992;30(6):473-483. [CrossRef] [PubMed]
- O'Connor GT, Caffo B, Newman AB, et al. Prospective study of sleep-disordered breathing and hypertension: the Sleep Heart Health Study. Am J Respir Crit Care Med. 2009;179(12):1159-1164. [CrossRef] [PubMed]
- Whitney CW, Gottlieb DJ, Redline S, et al. Reliability of scoring respiratory disturbance indices and sleep staging. Sleep. 1998;21(7):749-757. [CrossRef] [PubMed]
- Rechtschaffen A, Kales A. A Manual of Standardized Terminology, Techniques and Scoring System for Sleep Stages of Human Subject. Washington, D.C.: US Government Printing Office, National Institute of Health Publication, 1968.
- Marin JM, Carrizo SJ, Vicente E, Agusti AG. Long-term cardiovascular outcomes in men with obstructive sleep apnoea-hypopnoea with or without treatment with continuous positive airway pressure: an observational study. Lancet. 2005 Mar 19-25;365(9464):1046-53. [CrossRef] [PubMed]
- Shahar E, Whitney CW, Redline S, et al. Sleep-disordered breathing and cardiovascular disease: cross-sectional results of the Sleep Heart Health Study. Am J Respir Crit Care Med. 2001;163(1):19-25. [CrossRef] [PubMed]
- Young T, Finn L, Peppard PE, Szklo-Coxe M, Austin D, Nieto FJ, Stubbs R, Hla KM. Sleep disordered breathing and mortality: eighteen-year follow-up of the Wisconsin sleep cohort. Sleep. 2008 Aug;31(8):1071-8. [PubMed]
- Budhiraja R, Javaheri S, Parthasarathy S, Berry RB, Quan SF. The Association Between Obstructive Sleep Apnea Characterized by a Minimum 3 Percent Oxygen Desaturation or Arousal Hypopnea Definition and Hypertension. J Clin Sleep Med. 2019 Sep 15;15(9):1261-1270 [CrossRef] [PubMed]
- Qie R, Zhang D, Liu L, Ren Y, Zhao Y, Liu D, Liu F, Chen X, Cheng C, Guo C, Li Q, Zhou Q, Tian G, Han M, Huang S, Wu X, Qin P, Li J, Cao J, Zhang M, Huang J, Lu J, Li H, Wang J, Cheng R, Hu D. Obstructive sleep apnea and risk of type 2 diabetes mellitus: A systematic review and dose-response meta-analysis of cohort studies. J Diabetes. 2020 Jun;12(6):455-464. doi: 10.1111/1753-0407.13017. Epub 2020 Jan 22. [CrossRef] [PubMed]
- Yudi MB, Clark DJ, Farouque O, Andrianopoulos N, Ajani AE, Brennan A, Lefkovits J, Freeman M, Hiew C, Selkrig LA, O'Brien J, Dart AM, Reid CM, Duffy SJ; Melbourne Interventional Group. Trends and predictors of recurrent acute coronary syndrome hospitalizations and unplanned revascularization after index acute myocardial infarction treated with percutaneous coronary intervention. Am Heart J. 2019 Jun;212:134-143. [CrossRef] [PubMed]
- Lee CH, Khoo SM, Chan MY, Wong HB, Low AF, Phua QH, Richards AM, Tan HC, Yeo TC. Severe obstructive sleep apnea and outcomes following myocardial infarction. J Clin Sleep Med. 2011 Dec 15;7(6):616-21. [CrossRef] [PubMed]
- Maia FC, Goulart AC, Drager LF, Staniak HL, Santos IS, Lotufo PA, Bensenor IM. Impact of High Risk for Obstructive Sleep Apnea on Survival after Acute Coronary Syndrome: Insights from the ERICO Registry. Arq Bras Cardiol. 2017 Jan;108(1):31-37. [CrossRef] [PubMed]
- Budhiraja R, Javaheri S, Parthasarathy S, Berry RB, Quan SF. Incidence of hypertension in obstructive sleep apnea using hypopneas defined by a 3 percent oxygen desaturation or arousal but not by only 4 percent oxygen desaturation. J Clin Sleep Med. 2020 Jul 9. Epub ahead of print. PMID: 32643602.[CrossRef] [PubMed]
- Bouloukaki I, Grote L, McNicholas WT, Hedner J, Verbraecken J, Parati G, Lombardi C, Basoglu OK, Pataka A, Marrone O, Steiropoulos P, Bonsignore MR, Schiza SE; European Sleep Apnoea Database Network. Mild obstructive sleep apnea increases hypertension risk, challenging traditional severity classification. J Clin Sleep Med. 2020 Jun 15;16(6):889-898. [CrossRef] [PubMed]
- Hirotsu C, Haba-Rubio J, Andries D, Tobback N, Marques-Vidal P, Vollenweider P, Waeber G, Heinzer R. Effect of Three Hypopnea Scoring Criteria on OSA Prevalence and Associated Comorbidities in the General Population. J Clin Sleep Med. 2019 Feb 15;15(2):183-194. [CrossRef] [PubMed]
- Heinzer R, Vat S, Marques-Vidal P, Marti-Soler H, Andries D, Tobback N, Mooser V, Preisig M, Malhotra A, Waeber G, Vollenweider P, Tafti M, Haba-Rubio J. Prevalence of sleep-disordered breathing in the general population: the HypnoLaus study. Lancet Respir Med. 2015 Apr;3(4):310-8. [CrossRef] [PubMed]
- Sforza E, Roche F. Chronic intermittent hypoxia and obstructive sleep apnea: an experimental and clinical approach. Hypoxia (Auckl). 2016;499-108. [CrossRef] [PubMed]
- Ryan S. Mechanisms of cardiovascular disease in obstructive sleep apnoea. J Thorac Dis. 2018;10(Suppl 34):S4201-S4211. [CrossRef] [PubMed]
- Sulit L, Storfer-Isser A, Kirchner HL, Redline S. Differences in polysomnography predictors for hypertension and impaired glucose tolerance. Sleep. 2006;29(6):777-783. [CrossRef] [PubMed]
- Kapur VK, Resnick HE, Gottlieb DJ, for the Sleep Heart Health Study Group. Sleep Disordered Breathing and Hypertension: Does Self-Reported Sleepiness Modify the Association? Sleep. 2008;31(8):1127-1132. [CrossRef] [PubMed]
- Mazzotti DR, Keenan BT, Lim DC, Gottlieb DJ, Kim J, Pack AI. Symptom Subtypes of Obstructive Sleep Apnea Predict Incidence of Cardiovascular Outcomes. Am J Respir Crit Care Med. 2019;200(4):493-506. [CrossRef] [PubMed]
- Ogilvie RP, Lakshminarayan K, Iber C, Patel SR, Lutsey PL. Joint effects of OSA and self-reported sleepiness on incident CHD and stroke. Sleep Med. 2018 Apr;44:32-37. [CrossRef] [PubMed]
Cite as: Quan SF, Budhiraja R, Javaheri S, Parthasarathy S, Berry RB. The Association Between Obstructive Sleep Apnea Defined by 3 Percent Oxygen Desaturation or Arousal Definition and Self-Reported Cardiovascular Disease in the Sleep Heart Health Study. Southwest J Pulm Crit Care. 2020;21(4):86-103. doi: https://doi.org/10.13175/swjpcc054-20 PDF
Informe de políticas: Fatiga, sueño y salud del personal de enfermería, y cómo garantizar la seguridad de los pacientes y el público
Postura de la Academia Estadounidense de Enfermería sobre políticas
Claire C. Caruso, PhD, RN, FAANa*, Carol M. Baldwin, PhD, RN, CHTP, CT, AHN-BC, FAANa, Ann Berger, PhD, APRN, AOCNS, FAANb, Eileen R. Chasens, PhD, RN, FAANb, James Cole Edmonson, DNP, RN, FACHE, NEA-BC, FAANb, Barbara Holmes Gobel, MS, RN, AOCN, FAANb, Carol A. Landis, PhD, RN, FAANb, Patricia A. Patrician, PhD, RN, FAANb, Nancy S. Redeker, PhD, RN, FAHA, FAANb, Linda D. Scott, PhD, RN, NEA-BC, FAANc, Catherine Todero, PhD, RN, FAANb, Alison Trinkoff, ScD, RN, FAANb, Sharon Tucker, PhD, RN, FAANa
a Panel de expertos en comportamientos relacionados con la salud
b Academia Estadounidense de Enfermería
c Intermediaria del Consejo de la Academia para el panel de expertos en comportamientos relacionados con la salud
Editor's Note: This is a Spanish translation of the original article which was titled "Policy brief: Nurse fatigue, sleep, and health, and ensuring patient and public safety" published in Nursing Oulook. 2019 Sept;65(6):766-8 and is reproduced with the permission of Elsevier.
Resumen ejecutivo
La sociedad necesita servicios de enfermería esenciales a toda hora y, por ende, los enfermeros suelen trabajar por turnos y jornadas laborales extensas. Estos horarios pueden impedir que los enfermeros tengan las siete horas o más a diario de sueño de buena calidad que los expertos recomiendan (Watson, et al., 2015). Los enfermeros que trabajan por turnos y jornadas laborales extensas están en riesgo de tener enfermedad cardiovascular, trastornos gastrointestinales y sicológicos, cáncer, diabetes tipo 2, lesiones, trastornos osteomusculares, mortalidad por cualquier causa, desenlace reproductivo adverso y dificultad para manejar enfermedades crónicas (Caruso, et al., 2017; Caruso & Waters, 2008; Gan, et al. 2015; Gu, et al., 2015; DHHS, 2018; IARC Monographs Vol 124 Group, 2019; NIOSH, et al., 2015; Ramin, et al., 2014; Torquati, et al., 2017). Además, los enfermeros cansados están en riesgo de cometer errores en la atención de los pacientes y de sufrir accidentes vehiculares debido al estado de somnolencia (Bae y Fabry, 2014; Ftouni, et al., 2013; Geiger-Brown, et al., 2012; Geiger-Brown y Trinkoff, 2010; Lee, et al., 2016; Trinkoff, et al., 2011). La presencia del trabajo por turnos y jornadas laborales extensas también está relacionada con problemas de retención e incluso con la expresión por parte de los enfermeros de la intención de dejar o abandonar el trabajo (Hayes, et al., 2012; Moloney, et al., 2018). Estas condiciones han contribuido también a la escasez de enfermeros en ciertas especialidades y lugares de ejercicio de la profesión (Marc, et al., 2018). La escasez es una gran preocupación dado que la población envejece y se proyecta un fuerte aumento de la necesidad de enfermeros (Auerbach, Buerhaus y Staiger, 2017). De este modo, se requieren de manera apremiante intervenciones para reducir la fatiga en la enfermería. La Academia Estadounidense de Enfermería (la Academia) respalda los esfuerzos por reducir la fatiga en los enfermeros mediante educación, políticas en el lugar de trabajo y sistemas de gestión, así como medidas de respuesta a la fatiga. La Academia recomienda que los servicios de atención médica y las entidades normativas establezcan políticas para abordar este peligro generalizado en el lugar de trabajo, y promover así la salud y seguridad de los enfermeros junto con la seguridad de los pacientes y el público.
Antecedentes e importancia
Muchos puestos de enfermería requieren trabajar por turnos y jornadas laborales extensas debido a la necesidad de servicios de enfermería esenciales a toda hora. El trabajo por turnos son horas de trabajo por fuera del horario de lunes a viernes de 7 a. m. a 6 p. m. (Caruso y Rosa, 2007). Las jornadas laborales extensas son turnos con más de ocho horas de trabajo o más de 40 horas de trabajo por semana. Los enfermeros que trabajan por turnos y jornadas laborales extensas están en riesgo de presentar varias enfermedades crónicas, lesiones y desenlaces reproductivos adversos (Caruso, et al. 2017; Caruso y Waters, 2008; Gan, y cols., 2015; Gu, Torquati, et al., 2018).
La evidencia también indica que el trabajo por turnos y jornadas laborales extensas genera mayor desgaste y menos satisfacción laboral entre los enfermeros y contribuye a su escasez (Bae y Fabry, 2014; Geiger-Brown, et al., 2012; Geiger-Brown y Trinkoff, 2010; Trinkoff, et al., 2011). Los investigadores determinaron que los enfermeros que trabajan turnos de 10 horas o más tienen una probabilidad 2.5 veces mayor de reportar desgaste, insatisfacción laboral, reducción del bienestar, así como la intención de renunciar, en comparación con enfermeros que trabajan turnos más cortos (Stimpfel, Sloane y Aiken, 2012). El trabajo por turnos y jornadas laborales extensas seguramente es un factor importante que lleva al 43 % de los nuevos profesionales en enfermería titulados a dejar sus puestos de trabajo en el lapso de tres años (Goodman, 2016).
Los Centros para el Control y la Prevención de Enfermedades (CDC) establecieron que más del 52 % de los trabajadores de atención médica del turno nocturno informaron dormir seis horas o menos por día (CDC, 2012), lo cual es insuficiente de acuerdo con los expertos en sueño (Watson, et al., 2015). La falta de sueño afecta en forma adversa el desempeño de los enfermeros (Bae y Fabry, 2014; Caruso, et al., 2017). En los estudios se notifican efectos adversos en el desempeño de las personas que están despiertas por más de 17 horas que son similares a los de las que tienen un índice de alcoholemia del 0.05 %, y luego de que están despiertas 24 horas con las de un índice de alcoholemia del 0.10 % (Arnedt, et al., 2005; Dawson y Reid, 1997; Williamson y Feyer, 2000). Si bien el nivel legal de intoxicación por alcoholemia para conducir es de 0.08 % en los Estados Unidos, algunos países han establecido un índice de alcoholemia de 0.05 % debido a deficiencias para conducir (NHTSA, 2000). Además, las investigaciones de varios desastres industriales muy conocidos indican que la fatiga del trabajador ha sido uno de los factores causales (Baker Panel, 2007; NTSB, 2004; NTSB, 2009; Rogers Commission, 1986). El trabajo por turnos y jornadas laborales extensas está asociado con mayor insatisfacción de los pacientes, errores en la atención de los pacientes y mortalidad de pacientes (Geiger- Brown y Trinkoff, 2010; Olds y Clarke, 2010; Stimpfel, et al., 2012). Los riesgos para la seguridad se extienden a la familia de los enfermeros, las organizaciones de atención médica y el público cuando los enfermeros cansados cometen errores en el trabajo o el hogar, o se accidentan en sus vehículos debido a la conducción en estado de somnolencia (Bae y Fabry, 2014; Ftouni, et al., 2013; Geiger-Brown, et al., 2012; Geiger-Brown y Trinkoff, 2010; Lee, et al., 2016; Olds y Clarke, 2010; Scott, et al., 2007; Stimpfel, Sloane, y Aiken, 2012; Swanson, Drake y Arnedt, 2012; Trinkoff, et al., 2011).
Actualmente, son pocas las leyes estatales y federales en vigor en los Estados Unidos que atañen a las horas de trabajo de los enfermeros. Ninguna ley federal limita el número de horas que un enfermero puede trabajar ni especifica el diseño de sus horarios laborales. En cambio, en Europa la Directiva de la Unión Europea sobre ordenación del tiempo de trabajo limita las horas trabajadas por semana a 48 (Unión Europea, 2003). Un tercio de los estados prohíben o restringen las horas extras obligatorias para los enfermeros (Asociación de Enfermeros de Ohio, 2018). Estas leyes no contemplan los enfermeros que se ofrecen como voluntarios para trabajar horas extras, si bien las consecuencias para la salud y la seguridad de los enfermeros, así como para la seguridad de los pacientes y el público son similares. Muchas de las leyes en vigor que rigen las horas extras contienen disposiciones de emergencia que se interpretan en forma laxa, con lo cual las entidades invalidan los límites. Adicionalmente, muchos estados no tienen leyes que exijan a los empleadores brindar a los trabajadores pausas para las comidas y el descanso durante los turnos de trabajo (Departamento del Trabajo de los EE. UU.).
Los enfermeros y administradores en las organizaciones de atención médica tal vez no entiendan plenamente los riesgos para la salud y la seguridad que se asocian con la carencia de sueño, la fatiga y el trabajo por turnos y jornadas laborales extensas. Tal vez desconozcan también las estrategias basadas en la evidencia que hay disponibles para reducir estos riesgos (Baldwin, Schultz, y Barrere, 2016; NIOSH, et al., 2015). Sin embargo, la evidencia muestra que es posible limitar o modificar el impacto adverso del trabajo por turnos y jornadas laborales extensas mediante la mejora del sueño y la reducción de la fatiga.
La postura de la Academia
La Academia Estadounidense de Enfermería recomienda que el servicio de atención médica y las entidades normativas implementen políticas que propicien la salud del sueño (DHHS, 2010) de los enfermeros. Estas políticas son esenciales para promover una fuerza de trabajo alerta y sana que esté en mejores condiciones de ofrecer atención de enfermería excelente, a toda hora, y apoyar la capacidad de los enfermeros de mantener su propia salud y seguridad. La Academia respalda los esfuerzos para reducir la fatiga en los enfermeros mediante educación, políticas en el lugar de trabajo y sistemas de gestión, así como medidas de respuesta a la fatiga. Los administradores de atención médica y los enfermeros comparten la responsabilidad de priorizar la salud del sueño en los sistemas de gestión para organizar el trabajo y la vida personal de los enfermeros.
Dada la escasez de personal de enfermería y la demanda creciente por servicios de enfermería, se necesita hacer investigaciones para probar intervenciones que promuevan la capacidad de los enfermeros para brindar atención a toda hora y garantizar la disponibilidad de un número suficiente de enfermeros que brinden atención de alta calidad y satisfagan las necesidades de atención de los pacientes. Además, la Academia respalda el financiamiento para investigaciones sobre la mitigación del riesgo de fatiga de los enfermeros y temas relacionados con el bienestar de los proveedores y la seguridad de los pacientes.
Recomendaciones para los empleadores
Diseño del horario de trabajo. Diseños innovadores para los horarios de trabajo pueden ayudar a reducir la fatiga. Los administradores deben establecer límites a la duración de los turnos, el número de horas y los turnos trabajados por semana, así como al número de turnos consecutivos permitidos. Dado que los riesgos para la salud y la seguridad aumentan con el número de horas de trabajo (Bae y Fabry, 2014), los administradores pueden evitar la implementación de turnos más extensos que 12 horas y usar turnos más cortos, en especial durante las horas de la noche cuando los enfermeros tienen otros desafíos con el sueño y el mantenimiento del estado de alerta (Drake, et al., 2004; Pilcher, Lambert, y Huffcutt, 2000). Si se utilizan rotaciones de turnos, deben ser “hacia adelante” (por ejemplo, de días a tardes, de tardes a noches). Los administradores deben identificar y eliminar las políticas que alienten un número excesivo de horas extras y establecer restricciones sobre la cantidad y el momento en que los enfermeros pueden trabajar horas extras. Más específicamente:
- Programar turnos nocturnos de no más de 8 horas porque los turnos nocturnos largos conllevan un riesgo mayor de errores en la atención del paciente y de desenlaces adversos para la salud y la seguridad de los enfermeros (Bae y Fabry, 2014; Drake, et al., 2004; Geiger-Brown, et al., 2012; Geiger-Brown y Trinkoff, 2010; Fischer, et al., 2017; Pilcher, Lambert, y Huffcutt, 2000; Trinkoff, , et al., 2011).
- Diseñar horarios de trabajo con al menos 10 horas continuas o más de descanso por día, de manera que los enfermeros puedan obtener 7 horas o más de sueño por día, conforme recomiendan los expertos para los adultos (Watson, et al., 2015).
- Examinar los horarios de trabajo futuros de los enfermeros e intervenir para evitar patrones de horarios de trabajo con riesgo alto de fatiga.
Sistemas de gestión del riesgo de fatiga (FRMS, por sus siglas en inglés) (Lerman, et al., 2012). Los empleadores pueden establecer FRMS para brindar un enfoque integral a fin de reducir los riesgos de la fatiga. Los FRMS contribuyen al concepto de "cultura justa" (ANA, 2010), que reconoce que las fallas en los sistemas en el lugar de trabajo suelen ser causas importantes de errores. Los FRMS comprenden varios elementos: 1) institución de políticas en el lugar de trabajo para reducir el riesgo de fatiga; 2) establecimiento de procedimientos para proteger las tareas que son vulnerables a errores relacionados con la fatiga; 3) promoción de educación para administradores y enfermeros; 4) inclusión de factores relacionados con la fatiga en la investigación de incidentes; 5) establecimiento de sistemas anónimos de notificación de cuasiaccidentes e incidentes; 6) abordaje de los trastornos del sueño; y 7) búsqueda de mejoras continuas.
Evitar la conducción en estado de somnolencia. Aumenta la evidencia de que el trabajo por turnos y jornadas laborales extensas, la perturbación de los ritmos circadianos y la falta de sueño incrementan los riesgos de conducir soñoliento y los accidentes vehiculares (Ftouni, et al., 2013; Lee, et al., 2016; Scott, et al., 2007; Swanson, Drake y Arnedt, 2012). Scott et al. destacaron la necesidad de aumentar la concientización de los enfermeros y de establecer sistemas de gestión para evitar la conducción en estado de somnolencia para fines de seguridad de los enfermeros y el público (Scott, et al. 2007). Los administradores deben organizar campañas educativas y establecer procedimientos para el transporte de los enfermeros que estén demasiado cansados para conducir al hogar en forma segura (NIOSH, et al., 2015). Por ejemplo, los administradores pueden suministrar un servicio de taxi o llamar a un familiar para brindar transporte. Otra opción es disponer de habitaciones para que duerman los enfermeros cansados en proximidades del lugar de trabajo.
Sistemas para emergencias Durante las emergencias ambientales u otros desastres, los gerentes deben establecer sistemas de apoyo a la gestión para aumentar la capacidad de los enfermeros de seguir trabajando. Estos sistemas podrían incluir servicios que reduzcan las tareas no laborales en los enfermeros de manera que puedan dedicar su tiempo libre a descansar y dormir. Algunos ejemplos comprenden ofrecer habitaciones para dormir en el lugar, cuidado de niños y lavandería para los uniformes. Durante estas situaciones, los administradores deben evitar presionar a los enfermeros para que trabajen horas extras dado que los turnos más largos están asociados con un mayor número de errores y lesiones, así como con el desgaste.
Otras recomendaciones
Educación. Los enfermeros y sus administradores deben recibir educación sobre los riesgos para la salud, y la seguridad del trabajo por turnos y jornadas laborales extensas, así como sobre las estrategias basadas en la evidencia que pueden reducir estos riesgos. El Instituto Nacional para la Seguridad y Salud Ocupacional (NIOSH) ofrece un curso de capacitación en línea, gratuito e integral, titulado, Capacitación de NIOSH para enfermeros que trabajan por turnos y jornadas laborales extensas (NIOSH, et al., 2015). Otro recurso es la Declaración sobre la postura de la Asociación Estadounidense de Enfermeros, que aborda la fatiga de los enfermeros para promover la seguridad y la salud: Responsabilidades conjuntas de los profesionales en enfermería titulados y de los empleadores para reducir el riesgo (ANA, 2014). Además, debe incluirse contenido sobre los principales trastornos del sueño y su tratamiento, los riesgos para la seguridad de los enfermeros y los pacientes a raíz de la fatiga en relación con los trastornos del sueño y el trabajo por turnos y jornadas laborales extensas, así como estrategias para reducir los riesgos, en los currículos de enfermería de carrera corta, universitario y de posgrado.
Medidas de respuesta
Estas son estrategias para reducir la somnolencia y la fatiga. Comprenden siestas cortas y pausas para descanso durante el turno de trabajo, y el consumo razonable de cafeína. Las organizaciones de atención médica deben establecer políticas que dispongan pausas para descanso de 10 a 15 minutos durante los turnos cada 2 horas, y pausas adicionales para las comidas a fin de reducir el riesgo de fatiga, errores y lesiones (Fischer, et al., 2017). Los administradores también pueden crear horarios con tiempo para siestas breves planeadas durante los turnos de trabajo: las investigaciones indican que las siestas breves (entre 15 y 30 minutos) aumentan el grado de alerta durante los turnos de trabajo (Geiger-Brown, et al., 2016; Scott, et al., 2010). Otra medida de respuesta bien fundamentada es el consumo de pequeñas cantidades de cafeína teniendo cuidado de que el momento sea oportuno (NIOSH, et al., 2015). Adicionalmente, los empleadores deben trabajar para establecer procedimientos no punitivos para los enfermeros que estén demasiado fatigados para trabajar, como un plan de dotación de personal de reserva. Finalmente, las investigaciones de incidentes de las juntas estatales de enfermería deben incluir detalles sobre las horas de trabajo y los factores relacionados con el sueño que ocurrieron 3 días o más antes del error a fin de identificar los elementos que contribuyeron al incidente (Lerman, et al., 2012).
Agradecimientos
Los hallazgos y las conclusiones que aparecen en este informe pertenecen a los autores y no reflejan necesariamente la postura oficial del Instituto Nacional para la Seguridad y Salud Ocupacional, Centros para el Control y la Prevención de Enfermedades. Este artículo fue traducido y certificado por los Servicios Multilingües de los CDC (Centros para el Control y la Prevención de Enfermedades).
*Autora para la correspondencia: Claire C. Caruso, National Institute for Occupational Safety and Health, Centers for Disease Control and Prevention, 1090 Tusculum Avenue MS C-24, Cincinnati, OH 45226
Dirección de correo electrónico: ccaruso@cdc.gov (C.C. Caruso).
Publicado por Elsevier Inc. https://doi.org/10.1016/j.outlook.2019.08.004
Referencias
American Nurses Association (2010). Position statement: Just culture. Retrieved from https://www.nursingworld.org/»4afe07/globalassets/practiceandpolicy/health-and-safety/just_culture.pdf.
American Nurses Association (2014). Addressing nurse fatigue to promote safety and health: joint responsibilities of registered nurses and employers to reduce risk. Retrieved from https://www.nursingworld.org/»4afdfc/globalas sets/practiceandpolicy/health-and-safety/nursefatigue- position-statement-final.pdf .
Arnedt, J. T., Owens, J., Crouch, M., Stahl, J., & Carskadon, M. A. (2005). Neurobehavioral performance of residents after heavy night call vs after alcohol ingestion. JAMA, 294, 1025–1033.
Auerbach, D. I., Buerhaus, P. I., & Staiger, D. O. (2017). How fast will the registered nurse workforce grow through 2030? Projections in nine regions of the country. Nurs Outlook, 65, 116–122, doi:10.1016/j.outlook.2016.07.004 Epub 2016 Jul 13.
Bae, S. H., & Fabry, D. (2014). Assessing the relationships between nurse work hours/overtime and nurse and patient outcomes: systematic literature review. Nurs Outlook, 62, 138–156.
Baker Panel (2007). The report of the BP U.S. refineries independent safety review panel. Retrieved from https://www.csb.gov/bp-america-refinery-explosion/.
Baldwin, C. M., Schultz, A. A., & Barrere, C. C. (2016). Evidence- based practice (pp. 637_659). In B. M. Dossey, & L. Keegan (Eds.), Holistic nursing: a handbook for practice (7th ed.). Burlington, MA: Jones & Bartlett.
Caruso, C. C., Baldwin, C. M., Berger, A., Chasens, E. R., Landis, C., Redeker, N. S., et al. (2017). Position statement: Reducing fatigue associated with sleep deficiency and work hours in nurses. Nurs Outlook, 65, 766– 768.
Caruso, C. C., & Rosa, R. R. (2007). Shift work and long work hours. In W. N. Rom (Ed.), Environmental and Occupational Medicine, Chapter 90 (4th ed.). (pp. 1359_1363). Philadelphia: Lippincott Williams & Wilkins.
Caruso, C. C., &Waters, T. R. (2008). A review of work schedule issues and musculoskeletal disorders with an emphasis on the health care sector. Indust Health, 46, 523–534.
Centers for Disease Control and Prevention (CDC). (2012). Short sleep duration among workers—United States, 2010. MMWR, 61, 281–285.
Dawson, D., & Reid, K. (1997). Fatigue, alcohol and performance impairment. Nature, 388, 235.
Drake, C. L., Roehrs, T., Richardson, G., Walsh, J. K., & Roth, T. (2004). Shift work sleep disorder: prevalence and consequences beyond that of symptomatic day workers. Sleep, 27, 1453–1462.
European Union. (2003). Directive 2003/88/EC of the European Parliament and of the Council of 4 November 2003 concerning certain aspects of the organisation of working time. Retrieved from http://eur-lex.europa.eu/LexUriServ/LexUriServ.do?uri=CELEX:32003L0088:EN:HTML.
Fischer, D., Lombardi, D. A., Folkard, S., Willetts, J., & Christiani, D. C. (2017). Updating the "Risk Index": A systematic review and meta-analysis of occupational injuries and work schedule characteristics. Chronobiol Int, 34, 1423–1438, doi:10.1080/07420528.2017.1367305.
Ftouni, S., Sletten, T. L., Howard, M., Anderson, C., Lenne, M. G., Lockley, S. W., & Rajaratnam, S. M. (2013). Objective and subjective measures of sleepiness, and their associations with on-road driving events in shift workers. J Sleep Res, 22, 58–69.
Gan, Y., Yang, C., Tong, X., Sun, H., Cong, Y., Yin, X., Li, L., Cao, S., Dong, X., Gong, Y., Shi, O., Deng, J., Bi, H., & Lu, Z. (2015). Shift work and diabetes mellitus: a metaanalysis of observational studies. Occup Environ Med, 72, 72–78, doi:10.1136/oemed-2014-102150.
Geiger-Brown, J., Rogers, V. E., Trinkoff, A. M., Kane, R. L., Bausell, R. B., & Scharf, S. M. (2012). Sleep, sleepiness, fatigue, and performance of 12-hour-shift nurses. Chronobiol Int, 29, 211–219.
Geiger-Brown, J., Sagherian, K., Zhu, S., Wieroniey, M. A., Blair, L., Warren, J., Hinds, P. S., & Szeles, R. (2016). Napping on the night shift: a two-hospital implementation project. Am J Nurs, 116, 26–33.
Geiger-Brown, J., & Trinkoff, A. M. (2010). Is it time to pull the plug on 12-hour shifts? The evidence. J Nurs Adm, 40, 100–102.
Goodman, A. (2016). Nurse turnover rate infographic. Streamline Verify. Retrieved from https://www.streamlineverify.com/nurse-turnover-rate/.
Gu, F., Han, J., Laden, F., Pan, A., Caporaso, N. E., Stampfer, M. J., Kawachi, I., Rexrode, K. M., Willett, W. C., Hankinson, S. E., Speizer, F. E., & Schernhammer, E. S. (2015). Total and cause-specific mortality of U.S. nursing working rotating night shifts. Am J Prev Med, 48, 241–252.
Hayes, L. J., O’Brien-Pallas, L., Duffield, C., Shamian, J., Buchan, J., Hughes, F., Laschinger, H. K., & North, N. (2012). Nurse turnover: A literature review. An update. Int J Nurs Studies, 49, 887–905, doi:10.1016/.ijnurstu. 2011.10.001.
IARC Monographs Vol 124 Group. (2019). Carcinogenicity of night shift work. Lancet Oncol, 20, doi:10.1016/S1470- 2045(19)30455-3 online July 4.
Lee, M. L., Howard, M. E., Horrey, W. J., Liang, Y., Anderson, C., Shreeve, M. S., O’Brien, C. S., & Czeisler, C. A. (2016). High risk of near-crash driving events following night-shift work. Proc Natl Acad Sci, 113, 176–181, doi:10.1073/pnas.1510383112.
Lerman, S. E., Eskin, E., Flower, D. J., George, E. C., Gerson, B., Hartenbaum, N., Hursh, S. R., Moore- Ede, M., & American College of Occupational and Environmental Medicine Presidential Task Force on Fatigue Risk Management. (2012). Fatigue risk management in the workplace. J Occup Environ Med, 54, 231–258.
Mar_c, M., Bartosiewicz, A., Burzy_nska, J., Chmiel, Z., & Januszewicz, P. (2018). A nursing shortage: A prospect of global and local policies. Int Nurs Rev, doi:10.1111/ inr.12473 Jul 24, Epub ahead of print.
Moloney, W., Boxall, P., Parsons, M., & Cheung, G. (2018). Factors predicting Registered Nurses’ intentions to leave their organization and profession: A job demands-resources framework. J Adv Nurs, 74, 864– 875, doi:10.1111/jan.13497 Epub 2017 Dec 5.
National Highway Traffic Safety Administration (2000). On DWl laws in other countries. Retrieved from http://www.nhtsa.gov/people/injury/research/pub/DWIothercountries/dwiothercountries.html.
NIOSH, Caruso, C. C., Geiger-Brown, J., Takahashi, M., Trinkoff, A., & Nakata, A. (2015). NIOSH training for nurses on shift work and long work hours. (DHHS (NIOSH) Publication No. 2015-115). Cincinnati, OH: US Department of Health and Human Services, Centers for Disease Control and Prevention, Cincinnati, OH: National Institute for Occupational Safety and Health. Retrieved from https://www.cdc.gov/niosh/docs/2015-115/.
National Transportation Safety Board (NTSB). (2004). Grounding of U.S. Tank ship Exxon Valdez on Bligh Reef, Prince William Sound, Near Valdez, Alaska, March 04 1989. NTSB/ MAR-90/04.Washington, DC: NTSB.
National Transportation Safety Board. (2009). Aircraft Accident Report: loss of control on approach, Colgan Air, Inc., operating as Continental connection flight 3407, Bombardier DHC-8-400, N200WQ, Clarence Center, New York, February 12, 2009.Washington, DC: NTSB. Retrieved from http://www.ntsb.gov/investigations/AccidentReports/ Reports/AAR1001.pdf.
Ohio Nurses Association. (2018). House Bill 456/Prohibit Mandatory Overtime Passes House. Retrieved from http://ohnurses.org/house-bill-456-prohibit-manda tory-overtime-passes-house/.
Olds, D. M., & Clarke, S. P. (2010). The effect of work hours on adverse events and errors in health care. J Safety Res, 41, 153–162.
Pilcher, J. J., Lambert, B. J., & Huffcutt, A. I. (2000). Differential effects of permanent and rotating shifts on self-report sleep length: a meta-analytic review. Sleep, 23, 155–163.
Ramin, C., Devore, E. E., Wang, W., Pierre-Paul, J., Wegrzyn, L. R., & Schemhammer, E. S. (2015). Night shift work at specific age ranges and chronic disease risk factors. Occup Environ Med, 72, 1000–1007.
Rogers Commission. (1986). Report of the Presidential Commission on the Space Shuttle Challenger Accident. Volume II. Appendix G.Washington, DC: U.S. Government Printing Office.
Scott, L. D., Hofmeister, N., Rogness, N., & Rogers, A. E. (2010). An interventional approach for patient and nurse safety: a fatigue countermeasures feasibility study. Nurs Res, 59, 250–258.
Scott, L. D., Hwang, W. T., Rogers, A. E., Nysse, T., Dean, G. E., & Dinges, D. F. (2007). The relationship between nurse work schedules, sleep duration, and drowsy driving. Sleep, 30, 1801–1807.
Stimpfel, A. W., Sloane, D. M., & Aiken, L. H. (2012). The longer the shifts for hospital nurses, the higher the levels of burnout and patient dissatisfaction. Health Affairs (Millwood), 31, 2501–2509.
Swanson, L. M., Drake, C., & Arnedt, J. T. (2012). Employment and drowsy driving: a survey of American workers. Behav Sleep Med, 20, 250–257.
Torquati, L., Mielke, G. I., Brown, W. J., & Kolbe- Alexander, T. (2018). Shift work and the risk of cardiovascular disease. A systematic review and meta-analysis including dose-response relationship. Scand J Work Environ Health, 44, 229–238, doi:10.5271/sjweh.3700.
Trinkoff, A. M., Johantgen, M., Storr, C. L., Gurses, A. P., Liang, Y., & Han, K. (2011). Nurses’ work schedule characteristics, nurse staffing, and patient mortality. Nurs Res, 60, 1–8.
U.S. Department of Health and Human Services, Office of Disease Prevention and Health Promotion (2010). Healthy People 2020: Sleep Health. Retrieved from http://www.healthypeople.gov/2020/topics-objectives/topic/sleep-health.
U.S. Department of Labor (ND). State labor laws. Retrieved from http://www.dol.gov/whd/state/state.html.
Watson, N. F., Badr, M. S., Belenky, G., et al. (2015). Recommended amount of sleep for a healthy adult: a joint consensus statement of the American Academy of Sleep Medicine and Sleep Research Society. J Clin Sleep Med, 11, 591–592.
Williamson, A. M., & Feyer, A. M. (2000). Moderate sleep deprivation produces impairments in cognitive and motor performance equivalent to legally prescribed levels of alcohol intoxication. Occup Environ Med, 57, 649–655.
Cite as: Caruso CC, Baldwin CM, Berger A, Chasens ER, Edmonson JC, Gobel BH, Landis CA, Patrician PA, Redeker NS, Scott LD, Tordero C, Trinkoff A, Tucker S. Informe de políticas: Fatiga, sueño y salud del personal de enfermería, y cómo garantizar la seguridad de los pacientes y el público. Southwest J Pulm Crit Care. 2020;20(4):137-47. doi: https://doi.org/10.13175/swjpcc031-20 PDF
Sleep Tips for Shift Workers in the Time of Pandemic
Heidi M. Lammers-van der Holst, PhD
Audra S. Murphy, BS
John Wise, BS
Jeanne F. Duffy, MBA, PhD
Division of Sleep and Circadian Disorders
Department of Medicine
Brigham and Women’s Hospital
Boston, MA USA
Sleep is more important now than ever.
Getting enough sleep is a challenge for those who work nights even in the best of times, because our bodies are designed to be at rest during the night and awake and active during the day. Whether you are an experienced shift worker or new to shift work, the added stress from the COVID-19 pandemic has likely made sleep even more challenging over the past weeks.
Sleep does more than just make us feel better the next day. It allows us to pay close attention, remember new information, and multi-task. Over the long term, insufficient sleep can also impair our health, weakening our immune system, increasing inflammation, and leading to increased vulnerability to viral illnesses. Given how important sleep is for our safety, health, and quality of life, the following tips are designed to help those who work at night sleep their best.
Sleep tips for night shift workers.
- Plan for sleep! Build time for sleep into your daily schedule, and try to keep your sleep schedule the same each day as you work a series of night, evening, or day shifts.
- If you are on permanent nights, try to keep regularity in your sleep patterns even on days off.
- When working nights, try to shift your sleep so you wake up close to the start of the next night shift, rather than going to sleep as soon as you get home in the morning. Alternatively, split your sleep so that you sleep for a few hours when you get home in the morning and then take an extended nap that ends just before you have to go back to work the next night.
- Improve your sleep environment; keep your bedroom cool, dark, and quiet. Use an eye mask or blackout shades, and wear earplugs or try a white noise machine or app. If you live with family or roommates, let them know when your sleep times are so they can try not to disturb you.
- If you have to keep your phone with you while sleeping, avoid checking it if you wake during your sleep episode.
- If you are sleeping in a new environment, try to make it as comfortable as possible. Bring your pillow, favorite pajamas, slippers, etc. from home to make your new environment as comfortable and sleep-friendly as possible.
- Practice a soothing pre-bedtime routine, such as taking a warm shower or writing down stresses from your day; this will help you to unwind and tell your body ‘it’s time to sleep’.
- Use caffeine (coffee, cola, energy drinks) at the beginning of your shift, but avoid caffeine 3-4 hours before you want to go to sleep.
- Avoid alcohol before bedtime. While it might help you fall asleep, it will reduce the quality of your sleep and may make it more likely that you wake up early.
- Melatonin may help promote daytime sleep, but should be taken carefully because at the wrong time it may worsen sleep problems. Seek the advice of a sleep specialist for when and how much melatonin to take, and where best to obtain it.
Sleep, alertness, and safety for night shift workers.
- Shift workers are at high risk for having a drowsy driving accident while commuting (especially when commuting home in the morning after a night shift). Consider taking a short nap in your car before heading home. If you are driving and begin to feel drowsy, pull into a rest area or parking lot and take a short nap before continuing.
- Be aware that if you are new to shift work, or you are working longer hours than usual, you may be more likely than usual to make an error or have an accident while at work.
- While you are at work, try using small amounts of caffeine every 1-2 hours to help remain alert. This can be more effective than a large amount of caffeine only once or twice per shift.
- A short bout of exercise can make you feel more alert for the next hour or so.
- If possible, take a short (15-20 minutes or so) nap during your break time.
- Try a “coffee nap”! If you are very sleepy, drink a coffee (or other caffeinated drink) and immediately take a short (15-20 minutes) nap. By the time you wake up, the caffeine will have had a chance to act, and combined with the nap it should keep you going for the next couple of hours.
Additional information and help.
- Shift Work Disorder, a kind of circadian rhythm sleep-wake disorder. You should seek help from a sleep specialist if your symptoms persist for 3 months or longer. Find a sleep specialist at http://sleepeducation.org/find-a-facility.
- Information on fatigue among healthcare workers from the CDC/ NIOSH can be found at the following link: http://blogs.cdc.gov/niosh-science-blog/2020/04/02/fatigue-crisis-hcw/
- General information about sleep health can be found here: http://healthysleep.med.harvard.edu/
The authors are supported by grant R01 AG044416 from the National Institutes of Health.
Cite as: Lammers-van der Holst HM, Murphy AS, Wise J, Duffy JF. Sleep tips for shift workers in the time of pandemic. Southwest J Pulm Crit Care. 2020;20(4):128-30. doi: https://doi.org/10.13175/swjpcc024-20 PDF
Tips for Circadian Sleep Health While Working from Home
Robin K. Yuan PhD1
Enmanuelle Pardilla-Delgado PhD1,2
Kirsi-Marja Zitting PhD1
Jeanne F. Duffy MBA, PhD1
1Division of Sleep and Circadian Disorders, Department of Medicine, Brigham and Women’s Hospital and Division of Sleep Medicine, Harvard Medical School; 2Department of Psychiatry, Massachusetts General Hospital,
Boston, MA USA
Sleep is more important now than ever.
Getting enough sleep and maintaining a regular schedule for optimal circadian rhythm health is a challenge for most of us even in the best of times, but the schedule changes and added stress from the COVID-19-19, pandemic has likely impacted your sleep schedule over the past few weeks.
Sleep does more than just make us feel better the next day. It allows us to pay close attention, remember new information, and multi-task. Regularity of sleep and wake also maintains the health and optimal function of the circadian timing system (our internal biological clock). Insufficient sleep and irregular sleep-wake schedules can impair our health, weaken our immune system, increase inflammation, and even lead to increased vulnerability to viral illnesses. Given how important regular, sufficient, sleep is for our safety, health, and quality of life, the following tips may help to optimize circadian and sleep health in people now remaining at home.
Tips for optimal sleep and circadian rhythm health for those working from home.
- The good news is that if you are working from home, you may now have extra time for sleep! Many of us usually sleep less than our optimal amount, resulting in a chronic sleep debt. Now that you don’t have to commute, use that extra time for sleep to pay off your sleep debt.
- Many of us habitually cut our sleep short on weeknights and “sleep in” on weekends, which both creates a sleep debt and disrupts our internal biological clock. Working from home may allow you the time and flexibility to keep the same sleep schedule 7 days a week. If you are a night owl and can do your daytime work on your own schedule, embrace the flexibility to sleep at your (later) preferred times every night!
- Get up around the same time every day. Your wake time is like an anchor to your day and night. Keeping a consistent wake time will help other parts of your day fall into a routine and help you sleep better at night.
- Get bright light exposure during the day, especially in first hour or two after waking. Morning bright light, when received around the same time every day, is a powerful time signal to our body clock. Bright light has the added benefit of promoting alertness, which is particularly important if you find it difficult to get going in the morning. Try opening curtains to let in direct sunlight as soon as you wake up, taking a short walk outside before breakfast, or drinking your coffee on your balcony or in front of a window. When you are working, try to sit near a window where you can get as much sunlight exposure as possible.
- Try to make your first social interaction of the day at the same time each morning. When you are following “social distancing”, interacting with others can be difficult, especially if you live alone. Try to have a phone or video call with friends or family at about the same time each morning. Even a quick “hello” and check-in is useful. The other person will probably appreciate the human contact too!
- Eat your meals around the same time each day, especially breakfast. Eating meals at the same time of the day serves as a time cue and supports a healthy biological clock, which is important for sleep.
- Exercise around the same time each day and avoid being sedentary for long stretches of time. If possible, exercise outdoors so you can get bright light exposure.
- Keep daytime and night-time different and separate. Our body clock benefits from keeping day and night clearly distinguished. During daytime, keep your living space full of light and keep active doing your work from home or organizing, cooking, cleaning, and exercising. In the evening, keep the lights dim, block blue light on electronic devices, and do less active things such as watching TV, reading, or a sedentary hobby. Keep a regular pre-bedtime routine to help you unwind and tell your body ‘it’s time to sleep’.
- Avoid using light-emitting electronic devices (like laptops, tablets, smart phones) for at least 1 hour before your set bedtime. A dim evening environment can help your body naturally produce melatonin and prepare your body for sleep.
- Make sure your sleep environment is dark and quiet. Use an eye mask or blackout shades, wear earplugs or try a white noise machine or app. If possible, leave your phone in a different room.
Additional information and help.
- If you find yourself staying up later each night and sleeping later and later in the morning, you may be developing, a circadian rhythm sleep-wake disorder. You may want to seek help from a sleep specialist if this causes your problems with your work schedule or family.
- To block blue light from your electronic devices, turn the brightness of the screen to the lowest setting, and turn on apps such as f.lux (multi-platform) or Night Shift on iOSand Macs.
- General information about circadian rhythm health can be found here.
The authors are supported by NIH grants P01 AG09975 (RKY, KMZ, JFD), R01 AG044416 (JFD), T32 HL07901 (EP-D), F32 HL143893 (RKY), R01 AG054671 (EP-D), and the Milton Fund (KMZ).
Cite as: Yuan RK, Pardilla-Delgado E, Zitting K, Duffy J. Tips for circadian sleep health while working from home. Southwest J Pulm Crit Care. 2020;20(4):126-7. doi: https://doi.org/10.13175/swjpcc023-20 PDF
Impacto del Sueño y la Modalidad de Diálisis sobre la Calidad de Vida en una Población
Editor's Note: The following article was previously published in English in the SWJPCC as SWJPCC 017-19. It is reproduced in Spanish because of its relevance to our Spanish-speaking readers.
Luxana Reynaga-Ornelas, Ph.D., R.N.1
Carol M. Baldwin, Ph.D., R.N., AHN-BC, F.A.A.N.2
Kimberly Arcoleo, Ph.D., M.P.H.3
Stuart F. Quan, M.D.2,4,5
1 División de Ciencias de la Salud. Departamento de Enfermería y Obstetricia Sede León
Universidad de Guanajuato
Sede San Carlos; Blvd. Puente Milenio #1001; Fracción del Predio San Carlos; C.P. 37670; León, Gto, Mexico
2 Arizona State University, Edson College of Nursing and Health Innovation
PAHO/WHO Collaborating Centre to Advance the Policy on Research for Health
500 N. 3rd Street, Phoenix, AZ 85004
3 University of Rochester School of Nursing
Box SON, Helen Wood Hall
601 Elmwood Avenue, Rochester, NY 14642
4 Division of Sleep and Circadian Disorders Brigham and Women’s Hospital and Harvard Medical School
221 Longwood Ave. Boston, MA 02115
5 Asthma and Airway Disease Research Center, University of Arizona College of Medicine
1501 N. Campbell Ave., Tucson, AZ 85725
Resumen
Antecedentes: La calidad de vida relacionada con la salud (CVRS) se encuentra disminuida en la enfermedad renal en etapa avanzada (EREA) pero se conoce poco acerca del impacto de los trastornos del sueño, la modalidad de diálisis y los factores demográficos sobre la CVRS de pacientes mexicanos con EREA.
Métodos: Se incluyeron 121 adultos con EREA pertenecientes a 4 unidades de diálisis del estado de Guanajuato, México, estratificados por unidad y modalidad de diálisis (Hemodiálisis [HD], diálisis peritoneal continua ambulatoria [DPCA] y diálisis peritoneal automatizada [DPA]). Se realizó un análisis de la información clínica y los datos obtenidos del Sleep Hart Health Study Sleep Habits Questionnaire, del cuestionario corto del Medical Outcomes Study (MOS; SF-36) y de la Escala de Somnolencia Epworth.
Resultados: En general, los síntomas y los trastornos del sueño fueron frecuentes (ej. insomnio 37.2%). Los puntajes de SF-36 resultaron más bajos comparados con las normas de México y Estados Unidos. En la subescala de Vitalidad, los pacientes de HD reportaron mejor CVRS y los pacientes de DPCA la peor CVRS. En el modelo de análisis multivariado, la modalidad de diálisis y los trastornos del sueño en grupo y el ingreso bajo, resultaron asociados significativamente con una pobre calidad de vida total (SF-36) y una pobre salud mental (CVRS). Los modelos de calidad de vida total y del componente mental mostraron una CVRS significativamente mejor tanto para DPA como para la HD con tamaños del efecto de pequeño a moderado. El análisis de costo-efectividad mostró ventaja para la DPA.
Conclusiones: Los pacientes mexicanos de EREA tienen una CVRS reducida, y los trastornos del sueño pueden ser importantes para conducir a este hallazgo. La DPA debe ser la modalidad de diálisis de preferencia en México.
Introducción
La prevalencia de la enfermedad renal en etapa avanzada está aumentando en todo el mundo con una prevalencia estimada en 2010 de 4.9 millones de personas. Desafortunadamente, solo la mitad recibe diálisis; esta necesidad se proyecta más del doble para 2030 (1). La enfermedad renal en etapa avanzada está asociada con morbilidad y mortalidad cardiovascular, diabetes tipo 2, deterioro cognitivo, y trastornos minerales y óseos. En México, es un problema de salud significativo con una tasa de prevalencia e incidencia anual de 1,564 y 412 por millón de personas respectivamente, con mas de 65,000 individuos recibiendo diálisis (2). Además, entre el 2000 y el 2013, la tasa de incidencia de EREA ha incrementado 122% (2). Tiene una tasa de mortalidad de 12.3 muertes por 100,000 habitantes y es la segunda causa de años perdidos por muerte prematuras (2). El tratamiento más común para la EREA en México es la hemodiálisis (HD) llevada a cabo en centros de diálisis en más del 50% de los pacientes. Los restantes reciben diálisis peritoneal (DP) en casa, de los cuales 70% están en diálisis peritoneal continua ambulatoria (DPCA) y el 30% están en diálisis peritoneal automatizada (DPA) (2). Con la DPCA, la solución de diálisis se infunde manualmente hacia la cavidad peritoneal y es drenada después de pocas horas usualmente cuatro veces al día. Con la DPA, el proceso es automatizado con un equipo con alarmas y dispositivos de seguridad y es realizada durante la noche. El trasplante renal es poco frecuente.
El tratamiento para la EREA tiene significativas implicaciones fisiológicas y socioeconómicas para el individuo, la familia y la comunidad. No sorprende que las personas con EREA reporten una calidad de vida relacionada con la salud (CVRS) más pobre en comparación con la población general (3,4). Varios estudios han examinado el tipo de modalidad de diálisis y la CVRS. Se han identificado mejores puntajes de CVRS para DP comparado con HD en el tratamiento para la EREA (5,6), pero no siempre (7-9). Un meta análisis encontró una mejor calidad de vida basada en la utilidad para DPA comparado con DPCA (10) y un estudio reciente encontró que la DPA está asociada con una mejor salud física y moderados síntomas relacionados con la diálisis en comparación con la DPCA (11). La mayoría de los estudios incluidos en el meta análisis eran de Norteamérica, Europa o Asia. Existen pocos datos disponibles que comparen la CVRS según la modalidad de diálisis en personas con EREA en países de Latinoamérica incluyendo México.
Los trastornos del sueño en personas con EREA son comunes, con una prevalencia estimada 50 a mas de 80%, e influyen negativamente en la CVRS (12-14). En los pacientes con EREA se incluyen pesadillas, somnolencia excesiva diurna (SED), síndrome de piernas inquietas (SPI), síndrome de apnea del sueño (SAS), insomnio y pobre calidad del sueño (13). No es claro si la prevalencia y la severidad de los trastornos del sueño son similares entre las modalidades de diálisis; estudios previos han reportado resultados contradictorios con tasas equivalentes (15-17) y tasas diferentes (20). Solo un estudio realizó comparaciones entre HD, DPCA y DPA (20). Encontraron tasas similares de insomnio pero menores en SAS con HD, y mayores en SPI con DPA.
El propósito de este estudio fue determinar las asociaciones entre CVRS y los trastornos del sueño en función de la modalidad de diálisis en una población mexicana con EREA. Una asociación diferenciada puede ser un factor importante para la elección de las modalidades de diálisis. Nuestra hipótesis fue que en esta población, los trastornos del sueño serían un determinante importante de la CVRS en EREA, que DPA estaría asociada a una mejor calidad de vida y tendría un mayor costo-efectividad que la HD y la DPCA.
Métodos
Diseño
Se realizó un muestreo por conveniencia de 125 pacientes con EREA seleccionados entre personas aseguradas en el Instituto para la Salud y la Seguridad Social de los Trabajadores del Estado (ISSSTE) quienes vivían en el Estado de Guanajuato, México. Los participantes fueron seleccionados proporcionalmente por clusters. La muestra incluyó 30 pacientes de cada localidad geográfica de las unidades de diálisis de las ciudades de Celaya, Irapuato, Guanajuato y León; diez pacientes fueron seleccionados de cada modalidad (DPCA, DPA, y HD). Los pacientes fueron incluidos si tenían 18 años o más, hablaban español, recibían diálisis y no habían estado hospitalizados dentro de los tres meses previos al reclutamiento. Los pacientes con déficit cognitivo u otros déficits mentales que les impidieran completar los cuestionarios fueron excluidos del estudio. Fueron reclutados para su participación durante su reunión mensual, o bien en la sala de espera de consulta del especialista. En el momento de contacto inicial o con una cita posterior, se solicitaba al paciente que proporcionara el consentimiento informado, y completara de manera individual la entrevista y los cuestionarios que incluían información acerca de su salud, sueño y CVRS. También se les pidió dar un consentimiento para la revisión de sus expedientes. El estudio fue aprobado por el Comité de Ética de la Universidad de Guanajuato y el Consejo Institucional Revisor de Arizona State University.
Recolección de datos
Los entrevistadores capacitados obtuvieron información relacionada con edad, sexo, estado civil, estado socioeconómico (ESE), nivel de educación, número de hospitalizaciones, y tiempo desde el primer tratamiento. Los participantes también completaron la versión en español validada del cuestionario Sleep Heart Health Study Sleep Habits Questionnaire y de la versión corta en español de 36 items del Medical Outcomes Study (MOS) SF-36 para la medición de CVRS. Se registraron su peso y su estatura para determinar el índice de masa corporal (IMC). Del expediente médico de los participantes se recolectaron los datos más recientes de los últimos tres meses de niveles séricos de glucosa, albumina, creatinina, urea, y hematocrito/hemoglobina. Otros datos clínicos adicionales fueron recolectados para calcular el costo financiero como; etiología de la EREA, hospitalizaciones en el último año, tipo de catéter, dosis de diálisis, número de drogas antihipertensivas, uso de eritropoyetina, número de sesiones de HD por semana y tiempo de la última visita domiciliaria realizada por el equipo de salud
Instrumentos de medición
Sleep Heart Health Sleep Study (SHHS), Sleep Habits Questionnaire (SHQ). El instrumento SHQ ha sido utilizado frecuentemente con pacientes con trastornos del sueño no identificados. El cuestionario se enfoca en nueve aspectos de trastornos del sueño: 1) Ronquido; 2) Pausas en la respiración (apnea); 3) Apneas observadas por otros; 4) Somnolencia diurna; 5) Sueño insuficiente; 6) Síntomas de insomnio incluyendo sueño no reparador; 7) Pesadillas; 8) Síndrome de piernas inquietas; y 9) Duración del sueño reportado en días de la semana y fines de semana. Los síntomas de sueño fueron calificados en una escala de 5-puntos tipo Likert desde ‘Nunca’ hasta ‘Casi siempre’. El SHQ se desarrolló para el SHHS, ha sido utilizado en una variedad de investigaciones y es aceptado como un medio apropiado para caracterizar la salud del sueño. La versión en español del SHQ fue validada por Baldwin y colaboradores y muestra concordancia con la versión en inglés (21).
Epworth Sleepiness Scale. El Epworth Sleepiness Scale (ESS) es un instrumento validado de auto-llenado que pide a los sujetos que califiquen la posibilidad de quedarse dormido durante ocho situaciones comunes usando cuatro categorías ordinales que van del 0 (nula posibilidad) a 3 (alta posibilidad) (22). Los puntajes van de 0 al 24 con un puntaje >10 sugiriendo SSD (22). La versión en español del ESS fue incorporada al SHQ y ha demostrado una confiabilidad y validez equivalentes a la versión en inglés (23).
Medical Outcomes Survey (MOS) Versión corta SF-36 (Versión español). El MOS SF-36 es una medición ampliamente utilizada del estado de salud y la calidad de vida (24). Mide las variaciones en las prácticas y resultados del cuidado de la salud en una encuesta auto administrada que evalúa ocho dimensiones de salud. Los puntajes de cada subescala tienen un rango de 0-100, con puntajes más altos representando una mejor calidad de vida (24). Las subescalas miden los siguientes ocho conceptos de salud general: función física (FF), rol físico (RF), dolor corporal (DC), salud general (SG), vitalidad (VT), función social (FS), salud mental (SM) y rol emocional (RE). La versión en español fue validada en una población mexicana (25).
Puntajes SF-6. El formato corto-6D es una medida basada en una clasificación del estado de salud basado en preferencia, desarrollada del SF-36. Todos los participantes que completan el SF-36 pueden obtener un puntaje SF-6D (26). El SF-6D es una variable continua, calificada en una escala de 0.29-1.0, con 1.00 indicando salud óptima. Ha sido utilizada en evaluaciones económicas de intervenciones para EREA (27).
Análisis de Datos
Las variables continuas se reportan como medias y desviaciones estandard y las variables categóricas mediante porcentajes. Se utilizó la prueba de chi cuadrada para evaluar la asociación de las características demográficas con la modalidad de diálisis. Las comparaciones entre los puntajes de CVRS y los grupos de tratamiento se realizaron mediante análisis de varianza (ANOVA). Los tamaños del efecto se estimaron utilizando la d de Cohen. Se realizó un análisis de regresión linear controlando los factores sociodemográficos, los ingresos (ESE), y los trastornos del sueño. Para el análisis de los datos se utilizó SAS (V9.1) y el SPSS (V25). Se consideró una P <0.05 como estadísticamente significativo excepto cuando se señale.
Se realizó un análisis de costo-efectividad utilizando el método de año de vida ajustado a la calidad (QALY) para examinar el costo-efectividad de cada grupo de modalidad de diálisis. Los datos de los costos se obtuvieron de la información disponible en línea de fuentes gubernamentales mexicanas. Se calculó el QALY como el número de años en diálisis/hemodiálisis X el puntaje SF6D. La tasa de la diferencia en el costo sobre la diferencia en efectividad (QALY) se calculó para cada una de las tres terapias con lo que se obtuvo la tasa de incremento de costo-efectividad (ICER).
Resultados
De los 125 pacientes que fueron invitados a participar, solo 121 cubrieron los criterios de inclusión, y todos acordaron participar voluntariamente y firmar el consentimiento informado. Las características sociodemográficas y clínicas de los pacientes que consintieron participar se muestran en la Tabla 1.
Tabla 1. Características Sociodemográficas y Clínicas de los Participantes del Estudio por Modalidad de Diálisis.

Nota: ‡p<0.01; *p < 0.05; †p<0.10
DPA (Diálisis Peritoneal Automatizada); DPCA (Diálisis Peritoneal Continua Ambulatoria); HD (Hemodiálisis).
Hubo un porcentaje ligeramente mayor de hombres (55.4%) y el 39.7% tenían 65 años o más de edad. Las características clínicas no estuvieron disponibles para todos los pacientes. Sin embargo, los pacientes dializados con DPA fueron más jóvenes, con más años de educación, tenían mayores ingresos, consumían menos alcohol y era más común que estuvieran laborando. Hubo una tendencia de los pacientes de DPA a tener un mayor nivel de creatinina sérica. Aparte de lo anterior, no hubo más diferencias entre los grupos.
La prevalencia de trastornos y síntomas de sueño auto-reportada en total, así como su clasificación por modalidad de diálisis se presenta en la Tabla 2.
Tabla 2. Prevalencia de Trastornos y Síntomas del Sueño Auto-reportados por Tipo de Diálisis

Nota: *p < 0.05, †p <0.10
SDE (Somnolencia diurna excesiva); DPA (Diálisis Peritoneal Automatizada); DPCA (Diálisis Peritoneal Continua Ambulatoria); HD (Hemodiálisis).
Notablemente, todos los pacientes reportaron por lo menos un síntoma de sueño en el año anterior (datos no mostrados). El insomnio fue el trastorno reportado con mayor frecuencia y particularmente con mayor prevalencia en pacientes de HD, aunque este resultado no fue estadísticamente significativo. También se observó una tendencia de reportar mayores tasas de sueño no reparador en los pacientes de HD (42.5%) y DPCA (41.0%) comparados con los pacientes de DPA (19.0%). En contraste, los pacientes de DPA reportaron mayores tasas de apnea observada por otros y ronquido (14.3% y 25.6%, respectivamente) comparados con los pacientes en DPCA (10.3%, 19.4%) y HD (5.1%, 17.5%). Los pacientes en DPA reportaron con menor frecuencia SSD (11.9%) en la ESE pero esta diferencia no fue significativa al compararla con DPCA (25.6%) y HD (25.0%). La prevalencia de trastornos del sueño fue igual en los pacientes menores de 65 años al compararlos con los mayores de 65 años (datos no mostrados) excepto para el aspecto de despertarse muy temprano y no poder volver a quedarse dormidos (menores: 32.9% vs. mayores: 51.2%, p=0.05).
La Tabla 3 presenta la comparación de los ocho dominios del SF-36 y los puntajes del Resumen del Componente Físico y Mental (RCF y RCM) para los tres grupos de diálisis con tamaños de efecto para comparaciones pares.
Tabla 3. Puntajes Promedio y Desviaciones Estándar para los Dominios de SF-36, Puntajes de los Componentes Físico y Mental y Puntajes de SF-6D por Modalidad de Diálisis

Nota: ‡p<0.01; *p < 0.05; †p <0.10
PCF (Puntaje Componente Físico); PCM (Puntaje Componente Mental); DE (Desviación Estándar); DPA (Diálisis Peritoneal Automatizada); DPCA (Diálisis Peritoneal Continua Ambulatoria); HD (Hemodiálisis).
Los tamaños de efecto de Cohen d fueron calculados examinando las diferencias entre grupos de tipo de diálisis (tamaño de efecto pequeño ~0.2, tamaño de efecto mediano ~0.5, tamaño de efecto grande ~0.8)
Los pacientes en HD reportaron significativamente mejor CVRS para Vitalidad y una tendencia hacia una mayor Función Social comparado con las personas en DPCA y DPA; los pacientes en DPCA experimentaron una calidad de vida más pobre en estas dos escalas. Se observó una tendencia a indicar una mejor Función Física y Rol Físico de CVRS en los pacientes de DPA y HD en comparación con los pacientes de DPCA. Así mismo una tendencia a una mejor salud mental en el RCM para los que reciben HD y DPA comparado con los pacientes en DPCA. De manera Importante, los tamaños de efecto de varios dominios y subdominios mostraron ser generalmente pequeños a moderados para los contrastes entre DPCA y ya sea DPA o HD. De cualquier manera, las diferencias fueron pequeñas y poco importantes entre DPA y HD. No se observaron otras diferencias importantes entre los grupos en el SF-36.
Posteriormente, se investigaron los determinantes de la CVRS utilizando modelos multivariados con los factores sociodemográficos, comorbilidades, trastornos y síntomas de sueño auto reportados como posibles variables explicativas. La modalidad de diálisis (DPCA asociada con peor CVRS en comparación con HD y DPA, F=4.87, p<0.02), los trastornos y síntomas del sueño como grupo (p. e., cualquier síntoma relacionado con apnea obstructiva del sueño, insomnio, sueño insuficiente y síndrome de piernas inquietas, F=17.79, p<0.0001) y el ingreso económico (F=4.48, p<0.04) están asociados significativamente con peor CVRS en el RCM del SF-36, representando el 34% de la varianza (F=4.02, p<0.0004). En contraste, el modelo para el RCF no fue estadísticamente significativo. La CVRS fue significativamente mejor tanto para DPA (LSMedia=52.0+ 2.3) y HD (51.4 + 2.6) en comparación con DPCA (43.0 + 2.5, p<.025 vs. DPA/HD) en el modelo del Resumen del Componente Mental, pero no en el modelo de Resumen del Componente Físico (LSMedia: DPCA: 31.4 + 2.5, DPA: 33.7 + 2.3, HD: 34.8 + 2.5; p>0.05 para todas las comparaciones).
El análisis de costo-efectividad para cada modalidad de diálisis está en la Tabla 4.
Tabla 4. Análisis de Costos por Modalidad de Diálisis

Nota: DPA (Diálisis Peritoneal Automatizada; DPCA (Diálisis Peritoneal Continua Ambulatoria); HD (Hemodiálisis). QALY (Años de Vida Aujstados a Calidad), RICE (Tasa Incremental de Costo Efectividad); EI(Efectividad Incremental); CI (Costo Incremental).
Aunque la DPCA fue la menos costosa, fue la menos efectiva (QALY=0.71); la DPA fue menos costosa que la HD, pero fue más efectiva (DPA QALY: 2.05 vs. HD QALY: 1.44) y la HD fue la más costosa con moderada efectividad. Comparando las tasas de incremento de costo efectividad entre DPA, DPCA y HD, la DPA fue superior a ambos DPCA y HD, y la HD mejor que la DPCA.
Discusión
En este estudio, encontramos que existe una alta prevalencia de trastornos y síntomas del sueño entre la población mexicana de pacientes con EREA, con diferencias en las prevalencias según la modalidad de diálisis. Como en otras condiciones médicas crónicas, la CVRS, particularmente en los aspectos de salud mental, fue pobre en estos pacientes y de manera notable, la presencia de trastornos del sueño fue un determinante importante para una peor CVRS.
Consistentemente con previos reportes (12,13,28) observamos que los trastornos del sueño y sus síntomas son comunes entre pacientes mexicanos en diálisis. La explicación de la alta frecuencia de trastornos del sueño y sus síntomas en EREA es multifactorial incluyendo cuestiones metabólicas, medicamentos, pobre higiene de sueño y disfunción en el control ventilatorio (13). Además, encontramos que existen diferentes porcentajes de prevalencia para algunos trastornos del sueño y sus síntomas según las modalidades de diálisis. Las investigaciones previas que comparan la prevalencia de los trastornos del sueño entre modalidades de diálisis no han sido consistentes. Algunos estudios que comparan solo la DPA con la DPCA no encontraron diferencias (15-17). En otros, los problemas del sueño como un síntoma general tienden a ser más comunes en la DPA comparada con la DPCA (18), y más frecuentemente en HD en comparación con DP (19). En nuestro conocimiento, sólo existe un estudio que compara las frecuencias de trastornos del sueño y sus síntomas entre las tres modalidades de diálisis (20). En ese estudio, la frecuencia de insomnio fue alta (<80%), pero no diferente entre las modalidades de diálisis. La apnea obstructiva del sueño fue la menos común entre los pacientes de HD (36% vs. 60%[DPA] y 65% [DPCA]). Además, ellos observaron menos SPI en pacientes de HD (23%) en comparación con la DPA (50%) y la DPCA (33%). En contraste, nosotros observamos que el sueño no reparador, un síntoma del insomnio, fue más común en HD y DPCA, el ronquido y las apneas observadas por otros fueron más frecuentes en DPA, y no hubo diferencias en las tasas de prevalencia de SPI. La explicación de estas grandes discrepancias entre los estudios no es clara. Sin embargo, las posibilidades incluyen diferencias en las características sociodemográficas de las poblaciones de estudio y las preguntas utilizadas para recolectar la información. Se requieren estudios futuros, particularmente aquéllos que utilicen polisomnografía nocturna y cuestionarios estandarizados.
Encontramos que hubo pocas diferencias en la prevalencia de los trastornos del sueño y sus síntomas entre pacientes jóvenes y viejos con EREA. La única excepción fue el despertar muy temprano, que es una queja común en los ancianos y puede reflejar una fase avanzada de alteración del horario del sueño (29). Por otro lado, en contraste con nuestros hallazgos, las personas mayores de las cohortes de población general reportan más problemas con su sueño (30, 31). Proponemos que el impacto negativo de la EREA sobre la calidad del sueño tiene un mayor impacto entre los pacientes jóvenes, evitando así las diferencias por edad en las tasas de prevalencia.
A pesar de la disponibilidad de la diálisis para tratar la EREA, la CVRS se mantiene baja comparada con la población general (3,4). Nuestros hallazgos en una cohorte de pacientes con EREA mexicanos tratados con tres diferentes modalidades de diálisis no difieren y generalmente son consistentes con los datos de un estudio grande de pacientes con EREA de EUA (32). Sin embargo, comparado con un estudio previo de pacientes con EREA mexicanos, todos ellos recibiendo HD (28), encontramos menores puntajes en la Función Física y mayores puntajes en las escalas de Rol Emocional. En el presente estudio una tercera parte de los participantes corresponde a pacientes en DPCA, por lo que nuestro hallazgo de una peor Función Física puede atribuirse a los bajos puntajes de este subgrupo. La discrepancia en la escala de Rol Emocional, sin embargo, se mantiene sin explicación. Las comparaciones internacionales en CVRS en pacientes con EREA muestran una heterogeneidad considerable (32). Esto puede estar relacionado a la diversidad cultural, a los determinantes sociales de la salud, a las inequidades en salud o a las diferencias en el sistema de atención de la salud entre los países. En México, la disponibilidad y la adecuación de la diálisis varía considerablemente dependiendo de la seguridad social del paciente (2). Independientemente de las potenciales diferencias interculturales internacionales, es importante para los clínicos y los trabajadores de la salud saber que la CVRS está reducida en la EREA y que es comparable a otras condiciones crónicas médicas a pesar del uso de la diálisis. Nuestros resultados apoyan la recomendación de Jha y colaboradores de que los programas nacionales para las enfermedades crónicas deben incluir estrategias para reducir la carga y los costos relacionados a la enfermedad renal (33).
Es importante mencionar que en el análisis de multivariado encontramos la presencia de trastornos del sueño como el principal factor que afecta de manera adversa la CVRS, principalmente en el componente de salud mental de la CVRS. Otros estudios también han encontrado asociaciones negativas entre varios trastornos del sueño y la CVRS de los pacientes con EREA (12, 14). Nuestros resultados, sin embargo, amplían estas observaciones previas hacia la población latinoamericana. Éstos resaltan la importancia del sueño como un determinante de la CVRS en EREA y sugieren que la búsqueda de pobre calidad del sueño y los trastornos del sueño debería ser parte esencial del cuidado de los pacientes que se están tratando con diálisis crónica. Así mismo, deben desarrollarse estrategias para la promoción de la salud del sueño y ser implementadas en relación con esta población para evaluar la mejoría de la CVRS, de esta manera reduciendo los costos de salud, las secuelas por la EREA y el tipo de diálisis.
Además de los trastornos del sueño, observamos que la modalidad de diálisis fue un determinante importante en la CVRS. Existen varios estudios que han examinado el tipo de modalidad de diálisis con la CVRS y la mayoría reporta mejor CVRS en pacientes en DP comparados con HD como tratamiento para la EREA (5, 6). Un estudio en pacientes ancianos, sin embargo, no observó diferencias entre PD y HD (7). Se sugiere que las restricciones dietéticas y de viajes son menores, y que las oportunidades de recreación y de acceso a la diálisis se mejoran con la DP resultando un una mejor CVRS (34). Adicionalmente, los índices de depresión pueden ser mayores comparando la HD con la DP (5). Existen menos estudios que comparan la DPA con la DPCA (3, 16, 18, 35) y la mayoría muestra que la DPA está asociada con una mejor CVRS (3, 18, 35). El aporte de nuestro estudio es que es uno de los pocos en examinar la calidad de vida en las tres modalidades de diálisis simultáneamente (36). Nuestros resultados sugieren que en comparación con la HD y la DPA, la DPCA está asociada con una peor CVRS con tamaños de efecto pequeños a moderados; hubo poca diferencia entre la HD y la DPA con tamaños de efecto de ligeros a pequeños. La carga requerida para realizar continuos cambios de soluciones en la DPCA comparado con los intercambios automáticos por la noche en la DPA o con visitas programadas a los centros de diálisis para la HD, probablemente explica este hallazgo. Además, nuestro análisis de costo-efectividad indica que para el panorama socioeconómico de México, la DPA debería ser la modalidad preferida de diálisis.
Nuestro estudio tiene limitaciones importantes. Primero, la población de estudio no fue seleccionada prospectivamente o aleatorizada respecto a la modalidad de diálisis. Desafortunadamente, la elección de una modalidad de diálisis en México y en otros lados, depende del tipo de seguridad social, el ingreso económico del paciente o la disponibilidad de los recursos. De esta manera, es posible que nuestros hallazgos relacionados con la CVRS y los trastornos del sueño hayan sido impactados por un sesgo en la asignación. Por ejemplo, la DPCA puede haber sido proporcionada a los pacientes con menores ingresos, de manera que eso afecta en una peor CVRS. Intentamos mitigar esto controlando algunas de las variables de sesgo potencial con un análisis multivariado. De cualquier manera, puede estar presente alguna confusión residual. Segundo, nuestro análisis es transversal y no puede confirmarse la causalidad. Tercero, la presencia de trastornos del sueño y sus síntomas fue auto-reportada; puede haber existido error en la clasificación. Si hubo error de clasificación, sin embargo, ésta probablemente no hizo diferencias. Por último, nuestra muestra de estudio es relativamente pequeña; algunas diferencias no estadísticamente significativas pueden representar un error tipo II. De manera contraria, el uso de comparaciones múltiples puede haber resultado en un error tipo I en algunos casos.
En resumen, la CVRS está reducida en los pacientes con EREA mexicanos y la presencia de trastornos del sueño puede ser un importante conductor para este hallazgo. Las intervenciones dirigidas a mejorar la calidad del sueño y el tratamiento de los trastornos del sueño pueden mejorar la CVRS en esta población. Las diferencias en la CVRS entre las modalidades de diálisis sugieren que en México, la DPA debería ser la modalidad de diálisis de preferencia.
Reconocimientos
El financiamiento de apoyo fue proporcionado a la Dra. Luxana Reynaga-Ornelas por la beca Bardewick de Arizona State University y la beca PROMEP de la Universidad de Guanajuato. El Dr. Quan fue parcialmente apoyado por AG009975 del National Institute of Aging. Reconocemos con agradecimiento la participación en la revisión del texto en Español y la traducción inversa a la Dra. Ma. Guadalupe Reynaga-Ornelas, Nutrióloga y Doctora en Ciencias Médicas, profesora investigadora del Departamento de Medicina y Nutrición de la División de Ciencias de la Salud del Campus León de la Universidad de Guanajuato.
Referencias
- Liyanage T, Ninomiya T, Jha V, et al. Worldwide access to treatment for end-stage kidney disease: a systematic review. Lancet. 2015;385(9981):1975-82. [CrossRef] [PubMed]
- García-García G, García-Bejarano H, Breien-Coronado H, et al. Chapter 9 - End-Stage Renal Disease in Mexico. In: Chronic Kidney Disease in Disadvantaged Populations. García-García G, Agodoa LY and Norris K, eds. Cambridge, MA: Academic Press, 2017; 77-83. [CrossRef] [PubMed]
- Reina Neyra M, Cirera Segura F, Martín Espejo J. Salud Percibida por los Pacientes en DPCA y DPA. Rev Soc Esp Enferm Nefrol. 2008;11(2):26-33. [CrossRef]
- Guerini Rocco D, Mercieri A, Yavuzer G. Multidimensional health-status assessment of chronic hemodialysis patients: the impact on quality of life. Eura Medicophys. 2006;42(2):113-9. [PubMed]
- Ginieri-Coccossis M, Theofilou P, Synodinou C, Tomaras V, Soldatos C. Quality of life, mental health and health beliefs in haemodialysis and peritoneal dialysis patients: investigating differences in early and later years of current treatment. BMC Nephrol. 2008;914-2369-9-14. [CrossRef] [PubMed]
- Chen JY, Wan EYF, Choi EPH, et al. The health-related quality of life of chinese patients on hemodialysis and peritoneal dialysis. Patient. 2017;10(6):799-808. [CrossRef] [PubMed]
- Harris SA, Lamping DL, Brown EA, Constantinovici N, North Thames Dialysis Study (NTDS) Group. Clinical outcomes and quality of life in elderly patients on peritoneal dialysis versus hemodialysis. Perit Dial Int. 2002;22(4):463-70. [PubMed]
- Queeley GL, Campbell ES. Comparing treatment modalities for end-stage renal disease: A meta-analysis. Am Health Drug Benefits. 2018;11(3):118-27. [PubMed]
- Manavalan M, Majumdar A, Harichandra Kumar KT, Priyamvada PS. Assessment of health-related quality of life and its determinants in patients with chronic kidney disease. Indian J Nephrol. 2017;27(1):37-43. [CrossRef] [PubMed]
- Wyld M, Morton RL, Hayen A, Howard K, Webster AC. A systematic review and meta-analysis of utility-based quality of life in chronic kidney disease treatments. PLoS Med. 2012;9(9):e1001307. [CrossRef] [PubMed]
- Yang F, Luo N, Lau T, Yu ZL, Foo MWY, Griva K. Health-related quality of life in patients treated with continuous ambulatory peritoneal dialysis and automated peritoneal dialysis in Singapore. Pharmacoecon Open. 2018;2(2):203-8. [CrossRef] [PubMed]
- Brekke FB, Amro A, Hortemo Osthus TB, Dammen T, Waldum B, Os I. Sleep complaints, depression and quality of life in Norwegian dialysis patients. Clin Nephrol. 2013;80(2):88-97. [CrossRef] [PubMed]
- Hanly P. Sleep disorders and end-stage renal disease. Curr Opin Pulm Med. 2008;14(6):543-50. [CrossRef] [PubMed]
- Edalat-Nejad M, Qlich-Khani M. Quality of life and sleep in hemodialysis patients. Saudi J Kidney Dis Transpl. 2013;24(3):514-8. [CrossRef] [PubMed]
- Turkmen K, Yazici R, Solak Y, et al. Health-related quality of life, sleep quality, and depression in peritoneal dialysis and hemodialysis patients. Hemodial Int. 2012;16(2):198-206. [CrossRef] [PubMed]
- Guney I, Solak Y, Atalay H, et al. Comparison of effects of automated peritoneal dialysis and continuous ambulatory peritoneal dialysis on health-related quality of life, sleep quality, and depression. Hemodial Int. 2010;14(4):515-22. [CrossRef] [PubMed]
- Eryavuz N, Yuksel S, Acarturk G, et al. Comparison of sleep quality between hemodialysis and peritoneal dialysis patients. Int Urol Nephrol. 2008;40(3):785-91. [CrossRef] [PubMed]
- Bro S, Bjorner JB, Tofte-Jensen P, et al. A prospective, randomized multicenter study comparing APD and CAPD treatment. Perit Dial Int. 1999;19(6):526-33. [PubMed]
- Eghbali M, Shahqolian N, Nazari F, Babaee S. Comparing problems of patients with chronic renal failure undergoing hemodialysis and peritoneal dialysis referring to medical university's hospitals. Iran J Nurs Midwifery Res. 2009;14(1):1-5.
- Losso RL, Minhoto GR, Riella MC. Sleep disorders in patients with end-stage renal disease undergoing dialysis: comparison between hemodialysis, continuous ambulatory peritoneal dialysis and automated peritoneal dialysis. Int Urol Nephrol. 2015;47(2):369-75. [CrossRef] [PubMed]
- Baldwin CM, Choi M, McClain DB, Celaya A, Quan SF. Spanish translation and cross-language validation of a sleep habits questionnaire for use in clinical and research settings. J Clin Sleep Med. 2012;8(2):137-46. [CrossRef] [PubMed]
- Johns MW. A new method for measuring daytime sleepiness: the Epworth sleepiness scale. Sleep. 1991;14(6):540-5. [CrossRef] [PubMed]
- Ferrer M, Vilagut G, Monasterio C, Montserrat JM, Mayos M, Alonso J. Measurement of the perceived impact of sleep problems: the Spanish version of the functional outcomes sleep questionnaire and the Epworth sleepiness scale. Med Clin (Barc). 1999;113(7):250-5. [PubMed]
- Ware JE,Jr, Sherbourne CD. The MOS 36-item short-form health survey (SF-36). I. Conceptual framework and item selection. Med Care. 1992;30(6):473-83. [CrossRef] [PubMed]
- Zúniga AM, Carrillo-Jiménez TG, Fos JP, Gandek B, Medina-Moreno M. Evaluación del estado de salud con la Encuesta SF-36: resultados preliminares en México. Salud Pública de México. 1999;41(2):110-8. [CrossRef] [PubMed]
- Brazier J, Roberts J, Deverill M. The estimation of a preference-based measure of health from the SF-36. J Health Econ. 2002;21(2):271-92. [CrossRef]
- Davison SN, Jhangri GS, Feeny DH. Comparing the health utilities index mark 3 (HUI3) with the short form-36 preference-based SF-6D in chronic kidney disease. Value Health. 2009;12(2):340-5. [CrossRef] [PubMed]
- Dehesa-Lopez E, Correa-Rotter R, Olvera-Castillo D, Gonzalez-Parra C, Baizabal-Olarte R. Clinical, dialytic, and laboratory factors associated with poor health-related quality of life in Mexican patients on hemodialysis. Rev Invest Clin. 2016;68(4):192-200. [PubMed]
- Kim JH, Duffy JF. Circadian rhythm sleep-wake disorders in older adults. Sleep Med Clin. 2018;13(1):39-50. [CrossRef] [PubMed]
- Klink M, Quan SF. Prevalence of reported sleep disturbances in a general adult population and their relationship to obstructive airways diseases. Chest. 1987;91(4):540-6. [CrossRef] [PubMed]
- Ohayon MM, Zulley J, Guilleminault C, Smirne S, Priest RG. How age and daytime activities are related to insomnia in the general population: consequences for older people. J Am Geriatr Soc. 2001;49(4):360-6. [CrossRef] [PubMed]
- Fukuhara S, Lopes AA, Bragg-Gresham JL, et al. Health-related quality of life among dialysis patients on three continents: the Dialysis Outcomes and Practice Patterns Study. Kidney Int. 2003;64(5):1903-10. [CrossRef] [PubMed]
- Jha V, Garcia-Garcia G, Iseki K, et al. Chronic kidney disease: global dimension and perspectives. Lancet. 2013;382(9888):260-72. [CrossRef] [PubMed]
- Wu AW, Fink NE, Marsh-Manzi JV, et al. Changes in quality of life during hemodialysis and peritoneal dialysis treatment: generic and disease specific measures. J Am Soc Nephrol. 2004;15(3):743-53. [CrossRef] [PubMed]
- de Wit GA, Merkus MP, Krediet RT, de Charro FT. A comparison of quality of life of patients on automated and continuous ambulatory peritoneal dialysis. Perit Dial Int . 2001;21(3):306-12. [PubMed]
- Caballero-Morales S, Trujillo-Garcia JU, Welsh-Orozco U, Hernandez-Cruz ST, Martinez-Torres J. Calidad de vida en pacientes con hemodiálisis, diálisis peritoneal continua ambulatoria y automatizada. Arch Med Fam. 2006;8(3):163-8.
Cite as: Reynaga-Ornelas L, Baldwin CM, Arcoleo K, Quan SF. Impacto del sueño y la modalidad de diálisis sobre la calidad de vida en una población. Southwest J Pulm Crit Care. 2020;20(3):105-18. doi: https://doi.org/10.13175/swjpcc019-20 PDF
The Effect of CPAP on HRQOL as Measured by the Quality of Well-Being Self-Administered Questionnaire (QWB-SA)
Salma Batool-Anwar, MD, MPH1
Olabimpe Omobomi, MD, MPH1
Stuart F. Quan, MD1,2
1Division of Sleep and Circadian Disorders Medicine, Brigham and Women’s Hospital and Division of Sleep Medicine, Harvard Medical School, Boston, MA, 2Arizona Respiratory Center, University of Arizona College of Medicine, Tucson, AZ.
Abstract
Background: To examine the effect of continuous positive airway pressure (CPAP) on Health-related quality of life (HRQoL) as measured by the Quality of Well Being Self-Administered questionnaire (QWB-SA).
Methods: Participants from The Apnea Positive Pressure Long-term Efficacy Study (APPLES); a 6-month multicenter randomized, double-blinded intention to treat study, were included in this analysis. The participants with an apnea-hypopnea index >10 events/hour initially randomized to CPAP or Sham group were asked to complete QWB-SA at baseline, 2, 4, and 6-month visits.
Results: There were no group differences among either the CPAP or Sham groups. Mean age was 52±12 (SD] years, AHI 40±25 events/hr, BMI 32±7.1 kg/m2, and Epworth Sleepiness Score (ESS) 10±4 of 24 points. QWB-SA scores were available at baseline, and 2, 4 & 6 months after treatment in CPAP (n 558) and Sham CPAP (n 547) groups. There were no significant differences in QWB scores among mild, moderate or severe OSA participants at baseline. Modest improvement in QWB scores was noted at 2, 4 and 6- months among both Sham and CPAP groups (P <0.05). However, no differences were observed between Sham CPAP and CPAP at any time point. Comparison of the QWB-SA data from the current study with published data in populations with chronic illnesses demonstrated that the impact of OSA is no different than the effect of AIDS and arthritis.
Conclusion: Although the QoL measured by the QWB-SA was impaired in OSA it did not have direct proportionality to OSA severity.
Introduction
Obstructive Sleep Apnea (OSA) is characterized by recurrent episodes of upper airway narrowing and oxygen desaturation with resultant frequent nighttime awakenings and daytime sleepiness (1). A strong association between OSA and obesity has been described (2), and with the global epidemic of obesity (3), the prevalence of OSA is anticipated to increase. Recent studies have reported an increase in prevalence from 22 to 37% among men, and 17 to 50% among women (4).
Health related quality of life (HRQoL) relates to a World Health Organization definition of health comprised of physical, mental, spiritual and social wellbeing (5). A variety of questionnaires are used in epidemiologic studies to assess quality of life (QoL). Studies demonstrate that QoL is worse in persons with OSA (6). Continuous positive airway pressure (CPAP) is the gold standard for treating OSA and improves daytime sleepiness among adherent patients (7). However, studies examining the effect of CPAP on quality of life have not found consistent results (8,9). These discrepancies are attributed to the fact that there are two types of questionnaires which are used to assess QoL; generic or disease specific. Utilizing data from the Apnea Positive Pressure long term Efficacy Study (APPLES), a randomized controlled trial of CPAP vs Sham CPAP, we analyzed whether CPAP improved HRQoL using the self-administered version of the Quality of Well-Being Scale (QWB-SA), a well-validated generic HRQoL instrument, that has not been validated in OSA.
Materials and Methods
Study Population and Protocol. APPLES was a 6-month multicenter, randomized, double-blinded, 2-arm, sham-controlled, intention-to-treat study of CPAP efficacy on three domains of neurocognitive function in OSA. A detailed description of the protocol has previously been published (10). Briefly, the participants were recruited either through local advertisement or from those attending sleep clinics for evaluation of possible OSA. Symptoms indicative of OSA were used to screen potential participants. The initial clinical evaluation included administering informed consent and screening questionnaires as well as history and physical examination and medical assessment by a study physician. Participants subsequently returned 2-4 weeks later for a baseline 24-h sleep laboratory visit, during which polysomnography (PSG) was performed to confirm the diagnosis followed by a day of neurocognitive, mood, sleepiness, and QoL testing. Inclusion criteria have been published previously and included age ≥ 18 years and a clinical diagnosis of OSA, as defined by the American Academy of Sleep Medicine (AASM) criteria. Only participants with an apnea-hypopnea index (AHI) ≥ 10 by PSG were randomized to CPAP or sham CPAP and continued in the APPLES study. Exclusion criteria included previous treatment for OSA with CPAP or surgery, oxygen saturation on the baseline PSG <75% for >10% of the recording time, history of a motor vehicle accident related to sleepiness within the past 12 months, presence of several chronic medical conditions, use of various medications known to affect sleep or neurocognitive function, and other health and social factors that may impact standardized testing procedures (e.g., shift work). After randomization, participants underwent a CPAP or sham CPAP titration and were followed for 6 months on their assigned intervention. Subsequent study visits occurred at 2, 4 and 6 months after the titration PSG. The APPLES study was approved by an institutional review board for human studies at each clinical site; informed consent was obtained from all participants at the time of enrollment as previously described.
Quality of Well-Being Scale (QWB). The QWB is a comprehensive measure of HRQoL. It has been extensively validated and can be used to calculate quality-adjusted life years (QALYs) (11). Because of its complexity, a self-administered version, the QWB-SA was developed (12). The questionnaire is sensitive to changes at the higher levels of functioning and can also produce estimates of QALY for cost-effectiveness analyses. The QWB-SA includes 5 sections. The first assesses the presence/absence of 19 chronic symptoms or problems (e.g., blindness, speech problems). These chronic symptoms are followed by 25 acute (or more transient) physical symptoms (e.g. headache, coughing, pain), and 14 mental health symptoms and behaviors (e.g., sadness, anxiety, irritation). The remaining sections of the QWB-SA include assessments of mobility (including use of transportation), physical activity (e.g., walking and bending over) and social activity including completion of role expectations (e.g., work, school, or home). Scores from each subscale are coupled with population derived weights to yield one composite score ranging from 0.09 (lowest possible health state to 1 for perfect health, with zero meaning death.
The QWB-SA was administered at the baseline study visit and at each subsequent study visit. At each visit, we collected three scores (QWB1, QWB2, and QWB3) corresponding to the day of the survey and the immediate 2 previous days. These scores included combinations of questions from the 5 sections as follows:
- Part I: Acute and chronic symptoms
- Part II: Self Care
- Part III: Mobility
- Part IV: Physical activity
- Part V: Social activity
To calculate the QWB-SA the scores for each section were computed and combined according to guidelines provided by the University of California, San Diego (UCSD) Health Services Research Center to yield the QWB score for each day. From the daily scores, the QWB Average Score was derived as the mean of QWB1+QWB2+QWB3. We used the QWB Average Score in subsequent analyses.
Polysomnography (PSG). The PSG montage included monitoring of the electroencephalogram (EEG, C3-A2 or C4-A1, O2-A1 or O1-A2), electrooculogram (EOG, ROC-A1, LOC-A2), chin and anterior tibialis electromyograms (EMG), heart rate by 2-lead electrocardiogram, snoring intensity (anterior neck microphone), nasal pressure (nasal cannula), nasal/oral thermistor, thoracic and abdominal movement (inductance plethysmography bands), and oxygen saturation (pulse oximetry). All PSG records were electronically transmitted to a centralized data coordinating and PSG reading center. Sleep and wakefulness were scored using Rechtschaffen and Kales criteria (13). Apneas and hypopneas were scored using the American Academy of Sleep Medicine Task Force diagnostic criteria (14). Briefly, an apnea was defined by a clear decrease (> 90%) from baseline in the amplitude of the nasal pressure or thermistor signal lasting ≥ 10 sec. Hypopneas were identified if there was a clear decrease (> 50% but ≤ 90%) from baseline in the amplitude of the nasal pressure or thermistor signal, or if there was a clear amplitude reduction of the nasal pressure signal ≥ 10 sec that did not reach the above criterion, but was associated with either an oxygen desaturation > 3% or an arousal. Obstructive events were scored if there was a persistence of chest or abdominal respiratory effort. Central events were noted if no displacement occurred on either the chest or abdominal channels. The AHI was computed as the number of apneas and hypopneas divided by the total sleep time. Sleep apnea was classified as mild (AHI 10.0 to 15.0 events per hour), moderate (AHI 15.1 to 30.0 events per hour), and severe (AHI more than 30 events per hour) (14).
CPAP Adherence. Nightly use of CPAP was downloaded from the device and was assessed at 2, 4, 6-month intervals. The participants were considered adherent if CPAP use was ≥ 4 hours per night for >70% of nights.
Epworth Sleepiness Scale (ESS). The ESS is a validated self-completion tool that asks subjects to rate the likelihood of falling asleep in eight common situations using four ordinal categories ranging from 0 (no chance) to 3 (high chance) (15). Scores range from 0 to 24 with a score >10 suggesting EDS (15).
Calgary Sleep Apnea Quality of Life Index (SAQLI). The SAQLI was developed as a sleep apnea specific quality of life instrument (16). It is a 35-item instrument that captures the adverse impact of sleep apnea on 4 domains: daily functioning, social interactions, emotional functioning and symptoms. Items are scored on a 7- point scale with “all of the time” and “not at all” being the most extreme responses. Item and domain scores are averaged to yield a composite total score between 1 and 7. Higher scores represent a better quality of life.
Statistical Analysis. Simple linear and multiple regression models were used to estimate the degree to which variables correlated with QWB scores. We examined the association between the QWB-SA and the following variables: OSA severity as measured by the AHI, sleepiness as assessed by ESS, age, and baseline body mass index (BMI, kg/m2). Severity of OSA in this study was defined according to the AHI as follows: Mild (10-<15 /h), Moderate (15-<30 /h), Severe (>30 /h). Changes in QWB-SA over the duration of the study were analyzed using a mixed model repeated measures analysis of variance with participants stratified by their randomization group (CPAP or Sham CPAP). Analyses were performed using STATA (version 11, StataCop TX USA) and IBM SPSS v24 (Armonk, NY). Finally, we compared the sample means to the normative means using GraphPad Prism8.
Results
Initially, 558 participants were randomized to CPAP and 547 to Sham CPAP. As shown in Table 1, age, gender, ethnicity, body mass index (BMI, kg/m2), AHI, and ESS were similar between the CPAP and Sham CPAP groups.
Table 1. Baseline Characteristics.

SD: Standard Deviation, BMI: Body Mass Index, AHI: Apnea Hypopnea Index, ESS: Epworth Sleepiness Scale, SAQLI: Sleep Apnea Quality of Life Index, QWB: Quality of wellbeing
Men comprised of 50% of the study population and the population was generally obese (CPAP: BMI 32.4 ± 7.3; Sham: BMI 32.1 ± 6.9 kg/m2). The participants overall had at least 15 years of education, and over 50% of the participants were either married or living with someone. The sample population did not report severe excessive daytime sleepiness with the reported ESS approximately 10 in both the CPAP and SHAM groups. Similarly, there were no significant differences in SAQLI score, total sleep time or arousal index among the two treatment groups.
Scores for the QWB-SA were available at baseline and 2, 4 and 6 months after treatment in both groups. As shown in Table 2, there were no significant differences in QWB-SA at baseline between both groups.
Table 2. Mixed model analysis for the effect of time on QWB average score among CPAP and SHAM groups (N=1104).

*QWB-SA scores improved in both groups over the 6 months of follow-up, p<0.05.
In addition, scores among mild, moderate or severe OSA participants at baseline also were not different (data not shown). Modest improvement in QWB scores was noted at 2, 4 and 6- month among both Sham and CPAP groups (P<0.05). However, no differences were observed between Sham CPAP and CPAP at any time point. Furthermore, multiple regression analyses stratified by OSA severity, gender, and mean adherence to CPAP or Sham CPAP suggested significant improvement in QWB scores only among women with severe OSA in the CPAP group (data not shown, P <0.05).
Table 3 shows comparisons of the QWB-SA from the current study with published data in populations with acquired immune deficiency syndrome (AIDS), chronic obstructive lung disease (COPD), arthritis and prostate cancer (17-20).
Table 3. Comparison of sample mean to normative means.

QWB: Quality of Wellbeing, CF: Cystic Fibrosis, OSA: obstructive Sleep Apnea, AIDS: Acquired Immunodeficiency syndrome, COPD: Chronic Obstructive pulmonary Disease.
The impact of OSA is not different than the effect of AIDS and arthritis and only slightly less than with COPD and prostate cancer.
Discussion
In this study, we analyzed the effect of CPAP therapy on QoL using the QWB-SA questionnaire. We found that the cross-sectional mean QWB-SA scores were comparable to the scores found in other chronic illnesses (COPD, arthritis, cystic fibrosis, prostate cancer, and AIDS) (17-20) indicating that quality of life is adversely affected by sleep apnea similar to these chronic conditions. Although the QWB-SA modestly declined over a treatment duration of 6 months, the instrument was unable to distinguish any differences between CPAP and sham CPAP. Moreover, these findings remained after stratifying based on PAP adherence and OSA severity.
Assessment of quality of life (QoL) is an integral part of OSA management and various scales are being used by researchers. Studies using these instruments generally find that QoL is impaired in persons with OSA (6). However, to our knowledge, there have not been previous studies using the QWB-SA in a population with OSA. Our findings which demonstrate that the QWB-SA is low in OSA are consistent with these prior investigations. However, in contrast to our observations, some but not all studies have noted a greater impact of OSA on QoL in those with more severe disease. For example, Baldwin et al. (21) in the Sleep Heart Health Study found that there was a higher risk of having an impact on the vitality subscale of SF-36 with greater OSA severity. In contradistinction, Fornas et al. (22) using the Nottingham Health Profile found no relationship between OSA severity and differences in QoL in a moderate size group of OSA patients. This discrepancy may relate to whether a general population as in Baldwin et al or a clinical population as in Fornas et al. was studied. Additionally, instruments used to quantify QoL may assess different domains, thus leading to different conclusions. Thus, while the QWB-SA can detect that QoL is impaired in those with OSA, it does not have the capability to distinguish subtleties related to differences in OSA severity.
At baseline, we observed that scores on the QWB-SA were comparable to those found for patients with AIDS (23) and arthritis (20) but were slightly higher than those with COPD (18), cystic fibrosis (CF) (24), and prostate cancer (19). They are notably better than chronic renal failure on hemodialysis (0.49) (25). Thus, it appears that the impact of OSA on QoL is approximately the same as several but not all other chronic conditions that are viewed by the general public as having considerably greater health consequences.
Contrary to its use in cystic fibrosis and AIDS where QWB-SA has validity as an outcome measure (18-24) we did not find that the QWB-SA was able to detect changes in QoL with the use of CPAP. This observation also is contradistinction to results from the CPAP Apnea Trial North American Program using the Functional Outcomes of Sleep Questionnaire (FOSQ) as well as analyses of the Sleep Apnea Quality of Life Inventory (SAQLI) in the APPLES (26,27) study. In contrast to QWB-SA, both the FOSQ and SAQLI are sleep specific QoL instruments. Thus, the results of our study provide additional evidence that a generic HRQoL instrument may not be sensitive to the specific QoL domains impacted by treatment of OSA using CPAP. Other studies have concluded that changes in QoL in response to CPAP therapy may vary depending on the QoL measure used and that some measures may be more sensitive to detecting changes to QoL with CPAP therapy than others (28). A randomized control trial with a total of 1256 patients comparing various QoL tools concluded that generic QoL tools may not be sufficient at detecting important changes in QoL in OSA patients as CPAP may not improve general QoL scores but rather specific QoL domains. For instance, in that analysis, the SF-36 tool demonstrated positive changes only in physical function and energy levels with CPAP (29). In contrast, a study comparing 2 sleep specific QoL instruments to the generic 36-item short form survey (SF-36), found that the FOSQ and SAQLI provided unique information about health outcomes in treated OSA patients (30) and correlated well with the SF36 survey domains. In that study, the FOSQ was found to be more sensitive to differences in CPAP adherence than the SAQLI.
To our knowledge, this is the first study examining the effect of CPAP on QoL using the QWB-SA questionnaire. A major strength of the study is that it utilized data from a large multicenter randomized controlled trial with follow up and interval documentation of CPAP adherence for up to 6 months. However, there were several limitations. First, the study population was a mixture of patients recruited from sleep clinics and the general population; this may have resulted in a differential impact on QoL. Second, overall adherence to both CPAP and sham CPAP was relatively poor although not inconsistent with the results from other studies. Finally, QoL was assessed using the average QWB-SA total scores and hence it is unclear whether there may have been improvements in specific domains over time with CPAP treatment.
In conclusion, despite the limitations, we found that QoL measured by the QWB-SA was impaired in OSA but was not found to have direct proportionality to OSA severity. Furthermore, it was not sufficiently sensitive for detecting QoL changes in OSA patients on CPAP therapy. Our data support the use of sleep apnea specific QoL questionnaires for measurement of QoL after initiation of CPAP.
Acknowledgments
The Apnea Positive Pressure Long-term Efficacy Study (APPLES) study was funded by contract 5UO1-HL-068060 from the National Heart, Lung and Blood Institute. The APPLES pilot studies were supported by grants from the American Academy of Sleep Medicine and the Sleep Medicine Education and Research Foundation to Stanford University and by the National Institute of Neurological Disorders and Stroke (N44-NS-002394) to SAM Technology. In addition, APPLES investigators gratefully recognize the vital input and support of Dr. Sylvan Green, who died before the results of this trial were analyzed, but was instrumental in its design and conduct.
Administrative Core: Clete A. Kushida, MD, PhD; Deborah A. Nichols, MS; Eileen B. Leary, BA, RPSGT; Pamela R. Hyde, MA; Tyson H. Holmes, PhD; Daniel A. Bloch, PhD; William C. Dement, MD, PhD
Data Coordinating Center: Daniel A. Bloch, PhD; Tyson H. Holmes, PhD; Deborah A. Nichols, MS; Rik Jadrnicek, Microflow, Ric Miller, Microflow Usman Aijaz, MS; Aamir Farooq, PhD; Darryl Thomander, PhD; Chia-Yu Cardell, RPSGT; Emily Kees, Michael E. Sorel, MPH; Oscar Carrillo, RPSGT; Tami Crabtree, MS; Booil Jo, PhD; Ray Balise, PhD; Tracy Kuo, PhD
Clinical Coordinating Center: Clete A. Kushida, MD, PhD, William C. Dement, MD, PhD, Pamela R. Hyde, MA, Rhonda M. Wong, BA, Pete Silva, Max Hirshkowitz, PhD, Alan Gevins, DSc, Gary Kay, PhD, Linda K. McEvoy, PhD, Cynthia S. Chan, BS, Sylvan Green, MD
Clinical Centers
Stanford University: Christian Guilleminault, MD; Eileen B. Leary, BA, RPSGT; David Claman, MD; Stephen Brooks, MD; Julianne Blythe, PA-C, RPSGT; Jennifer Blair, BA; Pam Simi, Ronelle Broussard, BA; Emily Greenberg, MPH; Bethany Franklin, MS; Amirah Khouzam, MA; Sanjana Behari Black, BS, RPSGT; Viola Arias, RPSGT; Romelyn Delos Santos, BS; Tara Tanaka, PhD
University of Arizona: Stuart F. Quan, MD; James L. Goodwin, PhD; Wei Shen, MD; Phillip Eichling, MD; Rohit Budhiraja, MD; Charles Wynstra, MBA; Cathy Ward, Colleen Dunn, BS; Terry Smith, BS; Dane Holderman, Michael Robinson, BS; Osmara Molina, BS; Aaron Ostrovsky, Jesus Wences, Sean Priefert, Julia Rogers, BS; Megan Ruiter, BS; Leslie Crosby, BS, RN
St. Mary Medical Center: Richard D. Simon Jr., MD; Kevin Hurlburt, RPSGT; Michael Bernstein, MD; Timothy Davidson, MD; Jeannine Orock-Takele, RPSGT; Shelly Rubin, MA; Phillip Smith, RPSGT; Erica Roth, RPSGT; Julie Flaa, RPSGT; Jennifer Blair, BA; Jennifer Schwartz, BA; Anna Simon, BA; Amber Randall, BA
St. Luke's Hospital: James K. Walsh, PhD, Paula K. Schweitzer, PhD, Anup Katyal, MD, Rhody Eisenstein, MD, Stephen Feren, MD, Nancy Cline, Dena Robertson, RN, Sheri Compton, RN, Susan Greene, Kara Griffin, MS, Janine Hall, PhD
Brigham and Women's Hospital: Daniel J. Gottlieb, MD, MPH, David P. White, MD, Denise Clarke, BSc, RPSGT, Kevin Moore, BA, Grace Brown, BA, Paige Hardy, MS, Kerry Eudy, PhD, Lawrence Epstein, MD, Sanjay Patel, MD
Sleep HealthCenters for the use of their clinical facilities to conduct this research
Consultant Teams
Methodology Team: Daniel A. Bloch, PhD, Sylvan Green, MD, Tyson H. Holmes, PhD, Maurice M. Ohayon, MD, DSc, David White, MD, Terry Young, PhD
Sleep-Disordered Breathing Protocol Team: Christian Guilleminault, MD, Stuart Quan, MD, David White, MD
EEG/Neurocognitive Function Team: Jed Black, MD, Alan Gevins, DSc, Max Hirshkowitz, PhD, Gary Kay, PhD, Tracy Kuo, PhD
Mood and Sleepiness Assessment Team: Ruth Benca, MD, PhD, William C. Dement, MD, PhD, Karl Doghramji, MD, Tracy Kuo, PhD, James K. Walsh, PhD
Quality of Life Assessment Team: W. Ward Flemons, MD, Robert M. Kaplan, PhD
APPLES Secondary Analysis-Neurocognitive (ASA-NC) Team: Dean Beebe, PhD, Robert Heaton, PhD, Joel Kramer, PsyD, Ronald Lazar, PhD, David Loewenstein, PhD, Frederick Schmitt, PhD
National Heart, Lung, and Blood Institute (NHLBI)
Michael J. Twery, PhD, Gail G. Weinmann, MD, Colin O. Wu, PhD
Data and Safety Monitoring Board (DSMB)
Seven-year term: Richard J. Martin, MD (Chair), David F. Dinges, PhD, Charles F. Emery, PhD, Susan M. Harding MD, John M. Lachin, ScD, Phyllis C. Zee, MD, PhD
Other term: Xihong Lin, PhD (2 y), Thomas H. Murray, PhD (1 y).
Abbreviations
- AASM: American Academy of Sleep Medicine
- AHI: Apnea Hypopnea Index
- AIDS: Acquired immune deficiency syndrome
- APPLES: Apnea Positive Pressure Long-term Efficacy Study
- BMI: Body mass Index
- CF: Cystic Fibrosis
- COPD: Chronic obstructive pulmonary disease
- CPAP: Continuous positive airway pressure.
- EDS: Excessive daytime sleepiness
- EEG: Electroencephalogram
- ESS: Epworth sleepiness scale
- EMG: Electromyogram
- EOG: Electrooculogram
- FOSQ: Functional Outcomes of Sleep Questionnaire
- HRQoL: health related quality of life
- OSA: Obstructive Sleep apnea
- PSG: polysomnograpgy
- QALY: Quality Adjusted life years
- QoL: Quality of Life
- QWB: Quality of well being
- QWB-SA: Quality of well being-Self administered.
- SAQLI: Sleep apnea quality of life Index
- SD: Standard deviation
References
- American Academy of Sleep Medicine Task Force. Sleep-related breathing disorders in adults: recommendations for syndrome definition and measurement techniques in clinical research. Sleep. 1999;22:667-89. (CrossRef] (PubMed]
- Young T, Peppard Pe Fau-Taheri S, Taheri S. Excess weight and sleep-disordered breathing. J Appl Physiol 2005;99:1592-9.(CrossRef] (PubMed]
- Dietz WH. The response of the US Centers for Disease Control and Prevention to the obesity epidemic. Annu Rev Public Health. 2015;36:575-96. (CrossRef] (PubMed]
- Franklin KA, Lindberg E. Obstructive sleep apnea is a common disorder in the population-a review on the epidemiology of sleep apnea. J Thorac Dis. 2015;7:1311-22. (CrossRef] (PubMed]
- https://www.healthypeople.gov/2020/about/foundation-health-measures/Health-Related-Quality-of-Life-and-Well-Being
- Yang EH, Hla KM, McHorney CA, Havighurst T, Badr MS, Weber S. Sleep apnea and quality of life. Sleep. 2000;23:535-41. (CrossRef] (PubMed]
- Epstein LJ, Kristo D Fau - Strollo PJ, Jr., Strollo PJ Jr, Fau-Friedman N, et al. Clinical guideline for the evaluation, management and long-term care of obstructive sleep apnea in adults. J Clin Sleep Med. 2009;5:263-76. (PubMed]
- Windler S, Rowland S, Antic NA, et al. The effect of CPAP in normalizing daytime sleepiness, quality of life, and neurocognitive function in patients with moderate to severe OSA. Sleep. 2011;34:111-9. (CrossRef] (PubMed]
- McArdle N, Kingshott R, Engleman HM, Mackay TW, Douglas NJ. Partners of patients with sleep apnoea/hypopnoea syndrome: effect of CPAP treatment on sleep quality and quality of life. Thorax. 2001;56:513-8. (CrossRef] (PubMed]
- Kushida CA, Nichols DA, Quan SF, et al. The apnea positive pressure long-term efficacy study (APPLES): rationale, design, methods, and procedures. J Clin Sleep Med. 2006;2:288-300. (PubMed]
- Frosch DL, Kaplan RM, Ganiats TG, Groessl EJ, Sieber WJ, Weisman MH. Validity of self-administered quality of well-being scale in musculoskeletal disease. Arthritis Rheum 2004;51:28-31. (CrossRef] (PubMed]
- Kaplan RM, Sieber WJ, Ganiats TG. The quality of well-being scale: comparison of the interviewer-administered version with a self-administered questionnaire. Psychol Health. 1997;12:783-91. (CrossRef]
- Rechtschaffen A, Kales A. A manual of standardized terminology, techniques and scoring system for sleep stages of human subjects. Public Health Service,1968 - ci.nii.ac.jp
- Flemons WW, Buysse D, Redline S, Pack A. The report of American Academy of Sleep Medicine Task Force. Sleep related breathing disorders in adults: recommendations for syndrome definition and measurement techniques in clinical research. Sleep. 1999;22:667-89. (CrossRef] (PubMed]
- Johns MW. A new method for measuring daytime sleepiness: the Epworth sleepiness scale. Sleep. 1991;14:540-5. (CrossRef] (PubMed]
- Flemons W, Reimer MA. Development of a disease-specific health-related quality of life questionnaire for sleep apnea. Am J Respir Crit Care Med. 1998;158:494-503. (CrossRef] (PubMed]
- Kaplan RM, Anderson JP, Wu AW, Wm. Christopher M, Kozin F, Orenstein D. The quality of well-being scale: applications in AIDS, cystic fibrosis, and arthritis. Med Care. 1989;27:S27-S43. (CrossRef] (PubMed]
- Kaplan RM, Atkins CJ, Timms R. Validity of a quality of well-being scale as an outcome measure in chronic obstructive pulmonary disease. J Chronic Dis. 1984;37:85-95. (CrossRef] (PubMed]
- Frosch D, Porzsolt F, Heicappell R, et al. Comparison of German language versions of the QWB-SA and SF-36 evaluating outcomes for patients with prostate disease. Quality of Life Research. 2001;10:165-73. (CrossRef] (PubMed]
- Groessl EJ, Kaplan RM, Cronan TA. Quality of well-being in older people with osteoarthritis. Arthritis Care Res. 2003;49:23-28. (CrossRef] (PubMed]
- Baldwin CM, Griffith KA, Nieto FJ, O'Connor GT, Walsleben JA, Redline S. The association of sleep-disordered breathing and sleep symptoms with quality of life in the Sleep Heart Health Study. Sleep. 2001;24:96-105. (CrossRef] (PubMed]
- Fomas C, Ballester E, Arteta E, Ricou C, Diaz A, Fernandez A, Alonso J, Montserrat JM. Measurement of general health status in obstructive sleep apnea hypopnea patients. Sleep. 1995;18:876-79. (CrossRef] (PubMed]
- Anderson JP, Kaplan RM, Coons SJ, Schneiderman LJ. Comparison of the quality of well-being scale and the SF-36 results among two samples of ill adults: AIDS and other illnesses. J Clin Epidemiol. 1998;51:755-62. (CrossRef] (PubMed]
- Munzenberger PJ, Van Wagnen CA, Abdulhamid I, Walker PC. Quality of life as a treatment outcome in patients with cystic fibrosis. Pharmacotherapy. 1999;19:393-8. (CrossRef] (PubMed]
- Saban KL, Stroupe KT, Bryant FB, Reda DJ, Browning MM, Hynes DM. Comparison of health-related quality of life measures for chronic renal failure: quality of well-being scale, short-form-6D, and the kidney disease quality of life instrument. Quality of Life Research. 2008;17:1103-15. (CrossRef] (PubMed]
- Terri EW, Cristina M, Greg M, et al. Continuous positive airway pressure treatment of sleepy patients with milder obstructive sleep apnea. Am J Respir Crit Care Med 2012; 186: 677-83. (CrossRef] (PubMed]
- Batool-Anwar S, Goodwin JL, Kushida CA, et al. Impact of continuous positive airway pressure (CPAP) on quality of life in patients with obstructive sleep apnea (OSA). J Sleep Res. 2016; 25:731-8. (CrossRef] (PubMed]
- Antic NA, Catcheside P, Fau-Buchan C, Buchan C, Fau-Hensley M, et al. The effect of CPAP in normalizing daytime sleepiness, quality of life, and neurocognitive function in patients with moderate to severe OSA. Sleep. 2011;34:111-9. (CrossRef] (PubMed]
- Jing J, Huang T, Cui W, Shen H. Effect on quality of life of continuous positive airway pressure in patients with obstructive sleep apnea syndrome: a meta-analysis. Lung. 2008;186:131-44. (CrossRef] (PubMed]
- Billings ME, Rosen CL, Auckley D, et al. Psychometric performance and responsiveness of the functional outcomes of sleep questionnaire and sleep apnea quality of life index in a randomized trial: the HomePAP study. Sleep. 2014;37:2017-24. (CrossRef] (PubMed]
Cite as: Batool-Anwar S, Omobomi O, Quan SF. The effect of CPAP on HRQOL as Measured by the quality of Well-Being Self-Administered Questionnaire (QWB-SA). Southwest J Pulm Crit Care. 2020;20(1):29-40. doi: https://doi.org/10.13175/swjpcc070-19 PDF
Declaración de posición: Reducir la fatiga asociada con la deficiencia de sueño y las horas de trabajo en enfermeras
Posición de la Academia Estadounidense de Enfermería sobre políticas
Claire C. Caruso, PhD, RN, FAANa*, Carol M. Baldwin, PhD, RN, CHTP, CT, AHN-BC, FAANb, Ann Berger, PhD, APRN, AOCNS, FAANb, Eileen R. Chasens, PhD, RN, FAANb, Carol Landis, PhD, RN, FAANb, Nancy S. Redeker, PhD, RN, FAHA, FAANb, Linda D. Scott, PhD, RN, NEA-BC, FAANc, Alison Trinkoff, ScD, RN, FAANb
a Panel de expertos en comportamientos relacionados con la salud
b Academia Estadounidense de Enfermería
c Intermediaria del Consejo de la Academia para el panel de expertos en comportamientos relacionados con la salud
*Autora para la correspondencia
Editor's Note: This is a Spanish translation of the original article which was titled "Position statement: Reducing fatigue associated wtih sleep deficiency and work hours in nurses" published in Nursing Oulook 2017 Nov - Dec;65(6):766-8 and is reproduced with the permission of Elsevier.
La Academia Estadounidense de Enfermería promueve prácticas de gestión en organizaciones de atención médica, y estrategias en la vida personal de enfermeros y enfermeras, que respaldan la salud del sueño en estos profesionales y, como resultado, permiten contar con personal de enfermería alerta, que esté en condiciones de realizar sus labores y tenga una mayor posibilidad de vivir una vida saludable. La sociedad precisa servicios de enfermería esenciales a toda hora. Por consiguiente, el trabajo por turnos y las largas horas laborales son comunes en las organizaciones de atención médica y afectan negativamente a un considerable porcentaje de enfermeros y enfermeras. Trabajar de noche y en horarios irregulares afectan el funcionamiento humano, que se rige por la necesidad de dormir y los ritmos circadianos. La dificultad que enfrenta el personal de enfermería que trabaja por turnos es la necesidad de trabajar de noche (cuando nuestros mecanismos funcionales promueven el sueño) y dormir durante el día (cuando nuestros mecanismos funcionales promueven la actividad). Cuando el trabajo por turnos se combina con largas horas de trabajo (p. ej., turnos de 12 o más horas) y lleva a la falta de sueño o a la interrupción de los ritmos circadianos, los costos para la salud y la seguridad derivados de este conflicto con el funcionamiento humano son potencialmente significativos. La falta de sueño es un término amplio que incluye el sueño de duración inadecuada, el sueño de mala calidad, los trastornos del sueño sin tratar, y el sueño a destiempo que no está sincronizado con los ritmos circadianos. El sueño insuficiente puede afectar la disposición del personal de enfermería hacia el trabajo, su salud, seguridad y bienestar. Cada vez hay más evidencia de que los turnos largos, las rotaciones de turnos, los turnos dobles, así como los turnos vespertinos y nocturnos están asociados con varios riesgos para la salud y seguridad de estos profesionales, a corto y largo plazo (Instituto Nacional para la Seguridad y Salud Ocupacional [NIOSH]; NIOSH, Caruso, Geiger-Brown, Takahashi, Trinkoff y Nakata, 2015). Los enfermeros y las enfermeras que están cansados también corren el riesgo de cometer errores, relacionados con el cansancio, en la atención de los pacientes y poner a estos últimos en peligro (Bae y Fabry, 2014). Asimismo, estos riesgos se extienden a la familia del personal de enfermería, sus empleadores u organización de atención médica, y a la sociedad en general, cuando al estar cansados cometen errores en el trabajo y en el hogar, o chocan su vehículo por manejar somnolientos. Este peligro complejo requiere de una variedad de estrategias personales, del lugar de trabajo, y de salud pública para reducir estos riesgos. Lamentablemente, las personas que trabajan en organizaciones de atención médica quizás no entiendan por completo los riesgos para la salud y la seguridad que están asociados al cansancio y puede que no estén al tanto de las estrategias basadas en la evidencia para reducir estos riesgos. Sin embargo, la evidencia muestra que es posible limitar o modificar el impacto adverso que el trabajo por turnos y las largas horas laborales provoca en el personal de enfermería, al mejorar su sueño y reducir el cansancio.
Esta declaración de postura concuerda con tres de las metas estratégicas de la academia (Academia Estadounidense de Enfermería, 2017). (a) Influir en la creación e implementación de políticas que mejoren la salud de la población y logren la equidad en la salud. (b) Influir en el diseño de las prácticas a través de la ciencia de la enfermería para mejorar la salud de la población. (c) Posicionar a la academia y a la profesión de enfermería para que lideren los cambios y conduzcan las políticas y prácticas a fin de mejorar la salud y la atención médica. Estos esfuerzos tendrán un impacto en la fuerza laboral de enfermería, así como en la población de pacientes y la amplia variedad de otras personas con las que el personal de enfermería interactúa en el trabajo, el hogar y durante sus viajes de ida y vuelta al trabajo. Varios estudios indican que el personal de enfermería que trabaja por turnos y largas horas laborales están en riesgo de cometer errores en la atención de los pacientes (Bae y Fabry, 2014). Según la Fundación para la Seguridad Vial de la AAA (Tefft, 2016), el riesgo de choques vehiculares muestra una relación de dosis-respuesta en función de la duración del sueño: menos de 4 horas de sueño en las últimas 24 horas aumentan el riesgo de choque 11.5 veces; 4 a 5 horas de sueño lo aumentan 4.3 veces; 5 a 6 horas de sueño lo aumentan 1.9 veces, y 6 a 7 horas de sueño lo aumentan 1.3 veces. RAND informa que el sueño insuficiente podría costarle a la economía general de los Estados Unidos una suma ascendente de $411 000 millones anuales (el 2.28 % de su producto interno bruto) debido a una variedad de impactos negativos, productividad reducida, y la pérdida de 1.2 millones de días laborales al año (Hafner, Stepanek, Taylor, Troxel y Van Stolk, 2016).
Un número creciente de organizaciones reconoce los amplios riesgos para la salud y la seguridad que están vinculados al trabajo por turnos, las largas horas laborales y el cansancio del trabajador, y están trabajando para reducir estos riesgos. Las agencias gubernamentales, las organizaciones profesionales y de servicio público, y los profesionales de seguridad en varias industrias se están ocupando de este tema crítico.
Los esfuerzos gubernamentales incluyen el trabajo realizado por NIOSH de los Centros para el Control y la Prevención de Enfermedades. NIOSH está comprometido desde hace tiempo a reducir los riesgos derivados de estas exigentes horas laborales mediante investigación, orientación y recomendaciones bien fundamentadas, alianzas estratégicas, y difusión de información para proteger a los trabajadores y a sus familias, empleadores y la comunidad (NIOSH, 2017).
Para el personal de enfermería, NIOSH creó un programa de educación continua en línea, la capacitación de NIOSH para personal de enfermería que trabaja por turnos y durante largas horas (NIOSH et ál., 2015). Esta capacitación confiere información sobre los riesgos, las razones por las cuales ocurren, y brinda estrategias para que el personal de enfermería y sus supervisores reduzcan estos riesgos. Otros esfuerzos gubernamentales incluyen a 20 estados de los Estados Unidos que prohíben o restringen las horas extras obligatorias del personal de enfermería (Asociación Estadounidense de Enfermería [ANA], 2011). Otro ejemplo es el de la Tríada de Rendimiento de Medicina del Ejército de los Estados Unidos (Medicina del Ejército de los Estados Unidos, 2016), cuya meta es mejorar la preparación de los soldados, aumentar su resiliencia y promover su salud. La Tríada de Rendimiento se concentra en tres comportamientos:
(a) dormir bien, (b) hacer actividad física y (c) mejorar la alimentación. Un ejemplo adicional son las reglamentaciones federales de las horas de servicio para los modos de transporte y las plantas de energía nuclear. Estas reglamentaciones han estado vigentes por muchos años, con el fin de reducir el riesgo del público cuando los conductores de vehículos comerciales o los trabajadores de plantas de energía nuclear están cansados y cometen errores que ponen al público en peligro.
Varias organizaciones profesionales y de servicio público, como también los profesionales en el área de seguridad, cuentan con iniciativas diseñadas para abordar este peligro. La Asociación Estadounidense de Enfermería se ha ocupado activamente de este tema. En el 2014, difundió su declaración de postura revisada sobre el cansancio en el personal de enfermería, que promueve estrategias basadas en la evidencia para prevenir el cansancio y la somnolencia de estos profesionales, promover la salud, la seguridad y el bienestar de los profesionales en enfermería titulados, y asegurar resultados óptimos en los pacientes (ANA, 2014). Recientemente, la Asociación Estadounidense de Enfermería comenzó una iniciativa, Healthy Nurse, Healthy Nation (Enfermeros Saludables, Nación Saludable), que incluye promover la salud del sueño y prevenir el cansancio (ANA, 2016). La Organización Panamericana de la Salud/Organización Mundial de la Salud publicó el manual de capacitación "Su corazón, su vida", actualizado, del Instituto Nacional del Corazón, los Pulmones y la Sangre, de los Institutos Nacionales de la Salud, que contiene por primera vez una sesión sobre los trastornos del sueño y la promoción de la salud del sueño, con el fin de capacitar a los promotores, al personal de enfermería y a otros proveedores de atención médica de habla hispana acerca de la relación entre el sueño y la salud (Baldwin, 2014). Recientemente, el Consejo de Seguridad Nacional (2017) comenzó una nueva iniciativa para reducir los amplios riesgos asociados con el cansancio y el sueño inadecuado. Están abordando la salud y seguridad personal, como también los riesgos en el hogar, el trabajo, y en los caminos y las carreteras. Profesionales de seguridad y salud que trabajan en muchas industrias están incorporando en sus operaciones sistemas de gestión de riesgos relacionados con el cansancio (Lerman et ál., 2012). Estos sistemas integrales incluyen siete elementos: políticas de gestión; análisis de áreas vulnerables e institución de controles; sistemas de notificación para empleados, investigación de incidentes; capacitación para empleados y supervisores; manejo de trastornos del sueño; y un sistema de medidas correctivas y mejora continua.
La Academia Estadounidense de Enfermería reconoce que la práctica segura de la enfermería requiere que los proveedores de atención médica duerman durante el tiempo adecuado y que el sueño sea de calidad superior. El cansancio del personal de enfermería constituye un peligro para los pacientes debido al mayor riesgo de cometer errores; para otras personas en los caminos y las carreteras, cuando enfermeros y enfermeras cansados van y vuelven del trabajo, y para su propia salud y seguridad. Los supervisores y el personal de enfermería comparten la responsabilidad de reducir los riesgos vinculados al sueño insuficiente y el cansancio. Los supervisores tienen la responsabilidad de usar prácticas basadas en la evidencia al planificar los horarios laborales de sus empleados, y de establecer políticas, programas, prácticas y sistemas en el trabajo que promuevan la salud del sueño y una fuerza laboral alerta. El personal de enfermería tiene la responsabilidad de reservarse el tiempo suficiente para dormir, de adoptar prácticas y conductas personales, basadas en la evidencia, para maximizar el sueño y el estado de alerta, y de concientizar a las personas importantes en su vida para reducir las demandas conflictivas provenientes del trabajo y de las responsabilidades personales. La Academia Estadounidense de Enfermería apoya las iniciativas de las organizaciones de atención médica, de enfermeros y enfermeras en forma individual, y de las agencias gubernamentales y de salud pública para crear estrategias que mejoren la salud del sueño del personal de enfermería. Esto ayudará a garantizar que estos profesionales estén en condiciones de proveer una excelente atención a los pacientes a toda hora, y también los ayudará a mantener su propia salud, seguridad y sensación de bienestar. La Academia Estadounidense de Enfermería recomienda las siguientes medidas:
- Instar al personal de enfermería y a los empleadores de las organizaciones de atención médica a informarse sobre los riesgos para la salud vinculados al trabajo por turnos y las largas horas laborales, y sobre las estrategias basadas en la evidencia para reducir estos riesgos.
- Instar a los empleadores de las organizaciones de atención médica a incorporar prácticas basadas en la evidencia al planificar los horarios laborales de sus empleados, y establecer políticas, programas, prácticas y sistemas en el trabajo que promuevan la salud del sueño y una fuerza laboral alerta.
- Instar a los empleadores a promover una cultura en el lugar de trabajo que promueva la salud del sueño para lograr un nivel óptimo de funcionamiento, salud, seguridad y sensación de bienestar de su fuerza laboral.
- Alentar a los empleadores a que reconozcan el rol que el trabajo por turno, los turnos largos y el cansancio del personal de enfermería tienen en la rotación de empleados, el ausentismo, la seguridad de los pacientes y los costos relacionados.
- Instar a los expertos a desarrollar cursos adicionales de educación continua para el personal de enfermería y sus supervisores, que confieran información sobre prácticas personales e intervenciones en el lugar de trabajo, basadas en la evidencia, para maximizar la salud del sueño y el estado de alerta en enfermeros y enfermeras.
Agradecimientos
Las autoras agradecen profundamente a los miembros del panel de expertos en comportamientos relacionados con la salud por su trabajo de revisión y apoyo, y a las siguientes personas que brindaron sugerencias y orientación: Matthew J. Williams, JD, MA, gerente de políticas e intermediario del personal académico con el panel de expertos en comportamientos relacionados con la salud; Shannon Zenk, PhD, MPH, RN, FAAN, presidenta, panel de expertos en comportamientos relacionados con la salud; Marjorie McCullagh, PhD, RN, APHN-BC, COHN-S, FAAOHN, FAAN, copresidenta, panel de expertos en comportamientos relacionados con la salud; Judith Payne, PhD, RN, AOCN, FAAN, presidenta anterior, panel de expertos en comportamientos relacionados con la salud; otros miembros del subgrupo de cansancio del personal de enfermería, del panel de expertos en comportamientos relacionados con la salud: Patricia A. Patrician, PhD, RN, FAAN; Catherine Todero, PhD, RN, FAAN; y Sharon M. Weinstein, MS, RN, CRNI-R, CSP, FACW, FAAN. Los hallazgos y las conclusiones que aparecen en este informe pertenecen a las autoras y no necesariamente representan la opinión de NIOSH.
Este artículo fue traducido y certificado por los Servicios Multilingües de los CDC (Centros para el Control y la Prevención de Enfermedades). NIOSH proporcionó los fondos para redactar y traducir el artículo.*
*Funding for translation into Spanish provided by National Institute for Occupational Safety and Health, Centers for Disease Control and Prevention, Department of Health and Human Services, U.S.A. The translation was carried out by CDC Multilingual Services.
Este artículo se publicó en: Título de la publicación: Nursing Outlook; Volume 65 (6); Autores: Caruso CC, Baldwin CM, Berger A, Chasens ER, Landis C, Redeker NS, Scott LD, Trinkoff A; Nursing Outlook; Volume 65 (6); Título del artículo: Position statement: Reducing fatigue associated with sleep deficiency and work hours in nurses; Páginas 766-768; Derechos de autor Elsevier (2017).
Referencias
American Academy of Nursing. (2017). 2017–2020 Strategic plan. Washington, DC. Retrieved from http://www.aannet.org/about/strategic-plan-2017-20
American Nurses Association. (2016). Healthy Nurse, Healthy NationTM. Retrieved from http://www.nursingworld.org/MainMenuCategories/WorkplaceSafety/Healthy-Nurse
American Nurses Association. (2014). Addressing nurse fatigue to promote safety and health: Joint responsibilities of registered nurses and employers to reduce risks. Retrieved from http://nursingworld.org/MainMenuCategories/Policy-Advocacy/Positions-and-Resolutions/ANAPositionStatements/Position-Statements-Alphabetically/Addressing-Nurse-Fatigue-to-Promote-Safety-and-Health.html
American Nurses Association. (2011). Mandatory overtime: Summary of state approaches. Retrieved from http://nursingworld.org/MainMenuCategories/Policy-Advocacy/State/Legislative-Agenda-Reports/MandatoryOvertime/Mandatory-Overtime-Summary-of-State-Approaches.html
Bae, S. H., & Fabry, D. (2014). Assessing the relationships between nurse work hours/overtime and nurse and patient outcomes: Systematic literature review. Nursing Outlook, 62(2), 138–156.
Baldwin, C. M. (2014). Sesión 13: Los Trastornos del sueño y la promoción del sueño saludable. Camino a la Salud (Su corazón, su vida) Manual para Promotoras y Promotores. OMS/OPS, Washington, DC. Recuperar en http://iris.paho.org/xmlui/handle/123456789/4313
Hafner, M., Stepanek, M., Taylor, J., Troxel, W. M., & Van Stolk, C. (2016). Why sleep matters The economic costs of insufficient sleep: A cross-country comparative analysis. Santa Monica, CA: RAND Corporation.
Lerman, S. E., Eskin, E., Flower, D. J., George, E. C., Gerson, B., Hartenbaum, N. & American College of Occupational and Environmental Medicine Presidential Task Force on Fatigue Risk Management. (2012). Fatigue risk management in the workplace. Journal of Occupational and Environmental Medicine, 54, 231–258.
National Safety Council. (2017). Fatigued – You’re more than just tired. Retrieved from http://www.nsc.org/learn/NSC-Initiatives/Pages/Fatigue.aspx
NIOSH. (2017). Work schedules: Shift work and long work hours. Retrieved from www.cdc.gov/niosh/topics/workschedules
NIOSH, Caruso, C. C., Geiger-Brown, J., Takahashi, M., Trinkoff, A., & Nakata, A. (2015). NIOSH training for nurses on shift work and long work hours. (DHHS [NIOSH] Publication No. 2015-115). Cincinnati, OH: U.S. Department of Health and Human Services, Centers for Disease Control and Prevention, National Institute for Occupational Safety and Health.
Tefft, B. (2016). Acute sleep deprivation and risk of motor vehicle crash involvement. AAA Foundation for Traffic Safety. Retrieved from https://www.aaafoundation.org/sites/default/files/AcuteSleepDeprivationCrashRisk.pdf
U.S. Army Medicine. (2016). Performance triad. Retrieved from http://armymedicine.mil/Pages/performancetriad.aspx
Cite as: .Caruso CC, Baldwin CM, Berger A, Chasens ER, Landis C, Redeker NS, Scott LD, Trinkoff A. Declaración de posición: Reducir la fatiga asociada con la deficiencia de sueño y las horas de trabajo en enfermeras. Southwest J Pulm Crit Care. 2019;19:169-74. doi: https://doi.org/10.13175/swjpcc075-19 PDF
Impact of Sleep and Dialysis Mode on Quality of Life in a Mexican Population
Luxana Reynaga-Ornelas, Ph.D., R.N.1
Carol M. Baldwin, Ph.D., R.N., AHN-BC, F.A.A.N.2
Kimberly Arcoleo, Ph.D., M.P.H.3
Stuart F. Quan, M.D.2,4,5
1 División de Ciencias de la Salud. Departamento de Enfermería y Obstetricia Sede León
Universidad de Guanajuato
Sede San Carlos; Blvd. Puente Milenio #1001; Fracción del Predio San Carlos; C.P. 37670; León, Gto, Mexico
2 Arizona State University, Edson College of Nursing and Health Innovation
PAHO/WHO Collaborating Centre to Advance the Policy on Research for Health
500 N. 3rd Street, Phoenix, AZ USA 85004
3 University of Rochester School of Nursing
Box SON, Helen Wood Hall
601 Elmwood Avenue, Rochester, NY USA 14642
4 Division of Sleep and Circadian Disorders Brigham and Women’s Hospital and Harvard Medical School
221 Longwood Ave. Boston, MA USA 02115
5 Asthma and Airway Disease Research Center, University of Arizona College of Medicine
1501 N. Campbell Ave., Tucson, AZ USA 85725
Abstract
Background: Health-related quality of life (HR-QOL) is reduced with end-stage renal disease (ESRD) but little is known about the impact of sleep disorders, dialysis modality and demographic factors on HR-QOL of Mexican patients with ESRD.
Methods: 121 adults with ESRD were enrolled from 4 dialysis units in the state of Guanajuato, Mexico, stratified by unit and dialysis modality (hemodialysis [HD], continuous ambulatory peritoneal dialysis [CAPD] and automated peritoneal dialysis [APD]). Analysis included clinical information and data from the Sleep Heart Health Study Sleep Habits Questionnaire, the Medical Outcomes Study (MOS) short form (SF-36) HR-QOL measure and Epworth Sleepiness Scale.
Results: Overall, sleep symptoms and disorders were common (e.g., 37.2% insomnia). SF-36 scores were worse versus US and Mexican norms. HD patients reported better, while CAPD patients poorer HR-QOL for Vitality. With multivariate modelling dialysis modality, sleep disorders as a group and lower income were significantly associated with poorer overall SF-36 and mental health HR-QOL. Overall and Mental Composite Summary models showed HR-QOL was significantly better for both APD and HD with small to moderate effect sizes. Cost-effectiveness analysis demonstrated an advantage for APD.
Conclusions: Mexican ESRD patients have reduced HR-QOL, and sleep disorders may be an important driver of this finding. APD should be the preferred mode of dialysis in Mexico.
Introduction
The prevalence of end stage renal disease is increasing worldwide with an estimated prevalence in 2010 of 4.9 million persons. Unfortunately, only half receive dialysis; this need is projected to more than double by 2030 (1). End stage renal disease (ESRD) is associated with cardiovascular morbidity and mortality, type 2 diabetes, cognitive decline, and bone and mineral disorders. In Mexico, it is a significant health problem with annual prevalence and incidence rates of 1,564 and 412 per million persons respectively with over 65,000 individuals receiving dialysis (2). In addition, between 2000 and 2013, the incidence rate of ESRD has increased 122% (2). It has an annual mortality rate of 12.3 deaths per 100,000 inhabitants and is the second leading cause of years lost due to premature death (2). The most common treatment for ESRD in Mexico is hemodialysis (HD) performed at dialysis centers in over 50% of patients. The remainder receive peritoneal dialysis (PD) at home of which 70% are on continuous ambulatory peritoneal dialysis (CAPD) and 30% are on automated peritoneal dialysis (APD) (2). With CAPD, dialysis fluid is infused manually into the peritoneal cavity and then drained over a few hours usually four times per day. With APD, the process is automated with a device with alarms and safety features and is done at night. Kidney transplantation remains uncommon.
Treatment for ESRD has significant physiological, psychological and socio-economic implications for the individual, family, and community. Not surprisingly, persons with ESRD report poorer health-related quality of life (HR-QOL) compared with the general population (3, 4). Several studies have examined dialysis modality type on HR-QOL. Better HR-QOL scores have been noted for PD compared with HD treatment for ESRD (5, 6), but not always (7-9). A meta-analysis found better utility-based quality of life for APD compared to CAPD (10) and a recent study found APD associated with better physical health and milder dialysis-related symptoms than CAPD (11). Most of the studies used in the meta-analysis were from North America, Europe or Asia. There is little data available comparing HR-QOL among dialysis modalities for persons with ESRD in Latin American countries including Mexico.
Sleep disorders in persons with ESRD are common with prevalence estimates between 50 to more than 80%, and negatively influence HR-QOL (12-14). Among patients with ESRD, they include nightmares, excessive daytime sleepiness (EDS), restless leg syndrome (RLS), sleep apnea syndrome (OSA), insomnia and poor sleep quality (13). Whether the prevalence and severity of sleep disorders are similar among dialysis modalities is unclear; previous studies have been discordant with equivalent (15-17) and dissimilar rates and severity both reported (18-20). Only one study performed comparisons among HD, APD and CAPD (20). It found similar rates of insomnia, but less OSA with HD and more RLS with APD.
The purpose of this study was to determine the associations among HR-QOL and sleep disorders as a function of dialysis modality in a Mexican population with ESRD. A differential association may be an important factor in choice of dialysis modalities. We hypothesized that in this population, sleep disorders would be an important determinant of HR-QOL in ESRD, that APD would be associated with better QOL and be more cost-effective than HD or CAPD.
Methods
Design. Participants were a convenience sample of 125 patients with ESRD selected among persons insured by the Insurance and Social Service Institute for State Workers (ISSSTE) who were living in the state of Guanajuato, Mexico. Participants were proportionately selected by clusters. The sample included 30 patients from each geographic location of dialysis treatment units in the cities of Celaya, Irapuato, Guanajuato and Leon; ten patients were selected per dialysis modality (CAPD, APD, and HD). Patients were included if they were 18 years of age or older, Spanish-speaking, receiving dialysis and had not been hospitalized for the immediate 3 months prior to recruitment. Patients with cognitive or other mental health deficits that would preclude them from completing survey questionnaires were excluded from the study. They were recruited for participation during their monthly meetings, or in the waiting room for their specialist appointment. At the time of initial contact or a later appointment, the patient was asked to provide written informed consent, and to complete an individual interview and surveys that included information about their health, sleep and HR-QOL. They were also asked to give consent for chart review. The study was approved by the University of Guanajuato Ethics Committee and the Arizona State University Institutional Review Board.
Data Collection. Trained interviewers obtained information regarding age, sex, marital status, socioeconomic status (SES), educational level, number of hospitalizations, and time since first treatment. Participants also completed the Spanish translated and validated Sleep Heart Health Study Sleep Habits Questionnaire, and the Spanish version of the 36-item Medical Outcomes Study (MOS) short form (SF-36) HR-QOL measure. Height and weight were obtained to determine body mass index (BMI). Recent glucose, albumin, creatinine, urea, and hematocrit/hemoglobin blood levels were extracted from the patient’s medical record within the past three months. Additional clinical data collected to calculate the financial cost were ESRD etiology, hospitalizations within the past year, type of catheter, dialysis dose, number of anti-hypertensive drugs, use of erythropoietin, number of HD sessions per week and last home visit by the dialysis team.
Measurement Tools
Sleep Heart Health Sleep Study (SHHS), Sleep Habits Questionnaire (SHQ). The SHQ instrument has typically been used with patients with unidentified sleep disorders. The questionnaire addresses nine aspects of sleep disorders: 1) Snoring; 2) Breathing pauses (apnea); 3) Witnessed apneas; 4) Daytime sleepiness; 5) Insufficient sleep; 6) Insomnia symptoms including unrefreshing or nonrestorative sleep; 7) Nightmares, 8) Restless legs syndrome; and 9) Self-reported weekday and weekend sleep duration. Sleep symptoms questions were rated on a 5-point Likert-type scale from ‘Never’ to Almost Always.’ The SHQ, developed for the SHHS, has been used in a variety of investigations and is accepted as an appropriate means of characterizing sleep health. The Spanish version of the SHQ was cross-language validated by Baldwin and colleagues and shows excellent agreement with the English version (21).
Epworth Sleepiness Scale. The Epworth Sleepiness Scale (ESS) is a validated self-completion tool that asks subjects to rate the likelihood of falling asleep in eight common situations using four ordinal categories ranging from 0 (no chance) to 3 (high chance) (22). Scores range from 0 to 24 with a score >10 suggesting EDS (22). The Spanish version of the ESS was incorporated into the SHQ and has demonstrated equivalent reliability and validity as the English version (23).
Medical Outcomes Survey (MOS) Short Form SF-36 (Spanish version). The MOS SF-36 is a widely-used measure of health status and HR-QOL (24). It measures variations in health care practices and outcomes in a self-administered survey that assesses eight health dimensions. Scores for each subscale range from 0–100, with higher scores representing better QOL (24). Subscales measure the following eight general health concepts: physical functioning (PF), role physical (RP), bodily pain (BP), general health (GH), vitality (VT), social functioning (SF), mental health (MH) and role emotional (RE). The Spanish version was validated in a Mexican population (25).
SF-6 D scores. The short-form-6D is a preference-based health state classification developed from the SF-36. All participants who complete the SF-36 can be assigned an SF-6D score (26). The SF-6D is a continuous measure, scored on a 0.29-1.0 scale, with 1.00 indicating optimal health. It has been used in economic evaluations of interventions for ESRD (27).
Data Analysis
Continuous variables are reported as means and standard deviations and categorical variables by percentages. A chi-square test was used to assess the association of demographic characteristics with dialysis modality. Comparisons between HR-QOL scores and the treatment groups were performed by analysis of variance (ANOVA). Effect sizes were estimated using Cohen’s d. Multiple linear regression analysis was performed controlling for socio-demographic factors, income (SES) and sleep disorders. SAS (V9.1) and IBM SPSS (V25) were used for data analysis. P <0.05 was considered statistically significant unless otherwise stated.
A cost effectiveness analysis utilizing the quality-adjusted life year (QALY) method examined the cost-effectiveness of each dialysis modality group. Cost data was obtained from data available online from Mexican governmental sources. The QALY was computed as the number of years on dialysis/hemodialysis x SF-6D score. A ratio of the difference in cost to the difference in effectiveness (QALY) was computed for each of the three therapies which yielded the incremental cost-effectiveness ratio (ICER).
Results
Of 125 patients approached for recruitment, 121 fulfilled the inclusion criteria, and all agreed to voluntarily participate and provide written informed consent. Socio-demographic and clinical characteristics of the consenting patients are shown in Table 1.
Table 1. Socio-demographic and Clinical Characteristics of Study Participants by Dialysis Modality.

Note: ‡p<0.01; *p < 0.05; †p<0.10. APD (Automated Peritoneal Dialysis); CAPD (Continuous Ambulatory Peritoneal Dialysis); HD (Hemodialysis).
There was a slightly greater percentage of males (55.4%) and 39.7% were 65 years of age or older. Clinical characteristics were not available on all patients. However, patients dialyzed with APD were younger, more highly educated, had higher incomes, consumed less alcohol and were more likely to be working. There was a trend for APD patients to have a higher creatinine. Otherwise, there were no differences among the 3 groups.
The prevalence of self-reported sleep disorders or symptoms overall, as well as stratified by dialysis modality are presented in Table 2.
Table 2. Prevalence of Self-reported Sleep Disorders and Symptoms by Dialysis Type

Note: *p < 0.05, †p <0.10. EDS (Excessive Daytime Sleepiness); APD (Automated Peritoneal Dialysis); CAPD (Continuous Ambulatory Peritoneal Dialysis); HD (Hemodialysis).
Notably, all patients reported at least one sleep symptom in the past year (data not shown). Insomnia was the most frequently reported disorder and was particularly prevalent for patients receiving HD although not statistically significant. There also was a trend for HD (42.5%) and CAPD (41.0%) patients to report higher rates of non-restorative (unrefreshing) sleep compared to APD patients (19%). In contrast, APD patients reported higher rates of witnessed apnea and snoring (14.3% and 25.6%, respectively) compared to CAPD (10.3%, 19.4%) and HD (5.1%, 17.5%) patients. Patients receiving APD were less likely to report EDS (11.9%) on the ESS but this was not statistically significant compared to CAPD (25.6%) and HD (25.0%). The prevalence of sleep disorders was the same for those younger than 65 years of age in comparison to those older than 65 years (data not shown) except for problems with waking up too early and not being able to fall back asleep (younger: 32.9% vs. older 51.2%, p=0.05)
Table 3 presents the comparison of the eight SF-36 domains and the Physical and Mental Component Summary (PCS and MCS) scores for the three dialysis modality groups with effect sizes for pairwise comparisons.
Table 3. Mean Scores and Standard Deviations for SF-36 Domains, Physical and Mental Composite Scores and SF-6D Scores by Dialysis Modality

Note: ‡p<0.01; *p < 0.05; †p <0.10. PCS (Physical Composite Score); MCS (Mental Composite Score); SD (Standard Deviation); APD (Automated Peritoneal Dialysis); CAPD (Continuous Ambulatory Peritoneal Dialysis); HD (Hemodialysis). Cohen’s d effect sizes were calculated examining the differences between dialysis type groups (small effect size ~0.2, medium effect size ~0.5, large effect size ~0.8).
The patients on HD reported significantly better HR-QOL for Vitality and a trend towards higher Social Functioning compared to persons on CAPD and APD; the patients on CAPD experienced the poorest quality of life on these two scales. There was a trend for patients on APD and HD to indicate better Physical Functioning and Role Physical HR-QOL compared to the CAPD patients. There was a tendency for better mental health on the MCS for patients receiving HD and APD compared to patients on CAPD. Importantly, effect sizes for the various domains and subdomains showed that they were generally small to moderate for contrasts between CAPD and either APD or HD. However, they were trivial to small between APD and HD. No other notable differences were observed among groups on the SF-36.
Determinants of HR-QOL was further investigated using multivariate modelling with socio-demographic factors, co-morbidities and self-reported sleep disorders and symptoms as potential explanatory variables. Dialysis modality (CAPD associated with worse HR-QOL in comparison to HD and APD, F=4.87, p<.02), sleep disorders and symptoms as a group (i.e., any of symptoms consistent with obstructive sleep apnea, insomnia, insufficient sleep and restless legs syndrome, F=17.79, p<.0001) and lower income (F=4.48, p<.04) were significantly associated with worse HR-QOL on the Mental Composite Summary of the SF-36, accounting for 34% of the variance (F=4.02, p=.0004). In contrast, the model for the Physical Composite Summary was not statistically significant. HR-QOL was significantly better for both APD (Least Square Mean=52.0 + 2.3) and HD (51.4 + 2.6) in comparison to CAPD (43.0 + 2.5, p<.025 vs. APD/HD) in the Mental Composite Summary, but not the Physical Composite Summary models (Least Square Means: CAPD: 31.4 + 2.5, APD: 33.7 + 2.3, HD: 34.8 + 2.5; p>.05 for all comparisons).
Cost effectiveness analyses for each dialysis modality are in Table 4.
Table 4. Dialysis Modalities Cost Analysis

Note: APD (Automated Peritoneal Dialysis); CAPD (Continuous Ambulatory Peritoneal Dialysis); HD (Hemodialysis). QALY (quality-adjusted life year), ICER (Incremental Cost-Effectiveness Ratio); IE (Incremental effectiveness); IC (Incremental Cost).
Although CAPD was the least costly, it was the least effective (QALY=0.71); APD was less costly than HD, but was more effective (APD QALY: 2.05 vs. HD QALY 1.44) and HD was the most costly with moderate effectiveness. Comparing the incremental cost effectiveness ratios among APD, CAPD and HD, APD was superior to both CAPD and HD, and HD was better than CAPD.
Discussion
In this study, we found that there is a high prevalence of sleep disorders and symptoms among Mexican patients with ESRD with differences in prevalence among dialysis modalities. Like other chronic medical conditions, HR-QOL, particularly mental health aspects, was poor in these patients and notably, the presence of sleep disorders was an important determinant of poorer HR-QOL.
Consistent with previous reports (12, 13, 28), we observed that sleep disorders and symptoms of sleep disorders were common among Mexican patients on dialysis. The explanation for the high rate of sleep disorders and symptoms in ESRD is likely multifactorial including metabolic issues, medications, poor sleep hygiene and dysfunction in ventilatory control (13). In addition, we found that there were differences in prevalence rates for some sleep disorders and symptoms among dialysis modalities. Previous investigations comparing the prevalence of sleep disorders among dialysis modalities have not been consistent. Some studies comparing only APD to CAPD have found no differences (15-17). In others, sleep problems as a generic symptom tended to be more common among APD compared to CAPD (18), and more frequent among HD in comparison with PD (19). To our knowledge, there is one other study that compared the rates of sleep disorders and symptoms among all 3 dialysis modalities (20). In that study, the rates of insomnia were high (>80%), but not different among dialysis modalities. Obstructive sleep apnea was the least common in HD patients (36% vs 60% [APD] and 65% [CAPD]). Furthermore, they observed less RLS in HD patients (23%) in comparison to APD (50%) and CAPD (33%). In contrast, we observed that unrefreshing sleep, a symptom of insomnia, was more common in HD and CAPD, snoring and witnessed apneas to be more frequent in APD, and no differences in the prevalence rates of RLS. The explanation for the large amount of discrepancy among various studies is unclear. However, possibilities include differences in the socio-demographic characteristics of the study populations and the questions used to elicit information. Further studies are required, particularly ones that use overnight polysomnography and standardized questionnaires.
We found there were few differences in the prevalence of sleep disorders or their symptoms between older and younger patients with ESRD. The only exception was early morning awakenings which are a common complaint among the elderly and may reflect a phase advance in sleep timing (29). Otherwise, in contrast to our findings, older persons in general population cohorts report more problems with their sleep (30, 31). We propose that the negative impact of ESRD on sleep quality had greater impact on younger patients thus negating any age differences in prevalence rates.
Despite the availability of dialysis to treat ESRD, HRQOL remains low compared to the general population (3, 4). Our findings in a cohort of Mexican patients with ESRD being treated with 3 different dialysis modalities is no different and are generally consistent with data from a large study of US patients with ESRD (32). Compared to the previous study in Mexican patients with ESRD, all of whom were receiving HD (28), however, we found lower scores on the Physical Function and higher scores on the Role Emotional scales. One-third of the current study was comprised of patients on CAPD, and thus our finding of worse Physical Function can be attributed to lower scores among this subgroup. The discrepancy in the Role Emotional scale, however, remains unexplained. International comparisons of HRQOL in patients with ESRD exhibit considerable heterogeneity (32). This may be related to cultural diversity, social determinants of health, health inequality or differences in health delivery systems across countries. In Mexico, availability and adequacy of dialysis varies considerably according to the insurance status of the patient (2). Irrespective of potential cross-cultural and international differences, it is important for clinicians and health care workers to realize that HR-QOL is reduced in ESRD and comparable to other chronic medical conditions despite the use of dialysis. Our findings support the recommendation by Jha et al. that national programs for chronic diseases include strategies to reduce burden and costs relevant to kidney disease (33).
Importantly, we found that in multivariate analyses, the presence of sleep disorders was a major factor in adversely affecting HR-QOL with the primary impact on the mental health component of HR-QOL. Other studies also have found negative associations between various sleep disorders and HR-QOL in patients with ESRD (12, 14). Our findings, however, extend these previous observations to a Latin American population. They further highlight the importance of sleep as a determinant of HR-QOL in ESRD and suggest that screening for poor sleep and sleep disorders should be an essential part of the care of patients undergoing chronic dialysis. As well, sleep health promotion strategies should be developed and implemented relevant to this patient population and examined germane to improving HR-QOL, further reducing health care cost, sequelae from ESRD, and dialysis type.
In addition to sleep disorders, we observed that mode of dialysis was an important determinant of HR-QOL. Several extant studies also have examined dialysis modality type on HR-QOL and most report better HR-QOL for PD compared to HD treatment for ESRD (5, 6). One study in elderly patients, however, observed no difference between PD and HD (7). It is suggested that travel and dietary restrictions are fewer, and recreation opportunities and dialysis access are improved with PD resulting in better HR-QOL (34). In addition, indices of depression may be higher in comparisons of HD to PD (5). Comparisons of APD to CAPD are fewer (3, 16, 18, 35), with most showing that APD is associated with better HR-QOL (3, 18, 35). Our study extends these previous studies by being one of the few to examine quality of life among all three dialysis modalities simultaneously (36). Our results suggest that in comparison to HD and APD, CAPD is associated with worse HR-QOL with small to moderate effect sizes; there was little difference between HD and APD with trivial to small effect sizes. The burdensome requirement for continuous dialysate exchanges in CAPD compared to only nightly automated exchanges with APD or scheduled visits to a dialysis center for HD likely explains this finding. Furthermore, our cost-effectiveness analysis indicates that for the socio-economic landscape in Mexico, APD should be the preferred dialysis modality.
Our study has some important limitations. First, the study population was not prospectively selected or randomized with respect to dialysis modality. Unfortunately, choice of dialysis modality in Mexico and elsewhere is dictated frequently by health insurance, patient income and availability of resources. Thus, it is possible that our findings related to HR-QOL and sleep disorders may have been impacted by an assignment bias. For example, CAPD may have been differentially provided to patients with lower income, thus accounting for worse HR-QOL. We attempted to mitigated this by controlling for some of these potential biases with our multivariate analysis. Nevertheless, residual confounding may have been present. Second, our analyses are cross-sectional and causality cannot be confirmed. Third, the presence of sleep disorders and symptoms was self-reported; there may have been some misclassification. Any misclassifications, however, were likely non-differential. Last, our study sample is relatively small; some non-statistically significant differences may represent type II error. Conversely, use of multiple comparisons may have resulted in type I error in some cases.
In summary, HR-QOL is reduced in Mexican patients with ESRD and the presence of sleep disorders may be an important driver of this finding. Interventions targeted at improving sleep quality and treating sleep disorders may improve HR-QOL in this population. Differences in HR-QOL among dialysis modalities suggest that in Mexico, APD should be the preferred mode of dialysis.
Acknowledgements
Financial support was provided to Dr. Reynaga-Ornelas by the Bardewick Scholarship from Arizona State University and the PROMEP Scholarship from the University of Guanajuato. Dr. Quan was partially supported by AG009975 from the National Institute of Aging.
References
- Liyanage T, Ninomiya T, Jha V, et al. Worldwide access to treatment for end-stage kidney disease: a systematic review. Lancet. 2015;385(9981):1975-82. [CrossRef] [PubMed]
- García-García G, García-Bejarano H, Breien-Coronado H, et al. Chapter 9 - End-Stage Renal Disease in Mexico. In: Chronic Kidney Disease in Disadvantaged Populations. García-García G, Agodoa LY and Norris K, eds. Cambridge, MA: Academic Press, 2017; 77-83. [CrossRef] [PubMed]
- Reina Neyra M, Cirera Segura F, Martín Espejo J. Salud Percibida por los Pacientes en DPCA y DPA. Rev Soc Esp Enferm Nefrol. 2008;11(2):26-33. [CrossRef]
- Guerini Rocco D, Mercieri A, Yavuzer G. Multidimensional health-status assessment of chronic hemodialysis patients: the impact on quality of life. Eura Medicophys. 2006;42(2):113-9. [PubMed]
- Ginieri-Coccossis M, Theofilou P, Synodinou C, Tomaras V, Soldatos C. Quality of life, mental health and health beliefs in haemodialysis and peritoneal dialysis patients: investigating differences in early and later years of current treatment. BMC Nephrol. 2008;914-2369-9-14. [CrossRef] [PubMed]
- Chen JY, Wan EYF, Choi EPH, et al. The health-related quality of life of chinese patients on hemodialysis and peritoneal dialysis. Patient. 2017;10(6):799-808. [CrossRef] [PubMed]
- Harris SA, Lamping DL, Brown EA, Constantinovici N, North Thames Dialysis Study (NTDS) Group. Clinical outcomes and quality of life in elderly patients on peritoneal dialysis versus hemodialysis. Perit Dial Int. 2002;22(4):463-70. [PubMed]
- Queeley GL, Campbell ES. Comparing treatment modalities for end-stage renal disease: A meta-analysis. Am Health Drug Benefits. 2018;11(3):118-27. [PubMed]
- Manavalan M, Majumdar A, Harichandra Kumar KT, Priyamvada PS. Assessment of health-related quality of life and its determinants in patients with chronic kidney disease. Indian J Nephrol. 2017;27(1):37-43. [CrossRef] [PubMed]
- Wyld M, Morton RL, Hayen A, Howard K, Webster AC. A systematic review and meta-analysis of utility-based quality of life in chronic kidney disease treatments. PLoS Med. 2012;9(9):e1001307. [CrossRef] [PubMed]
- Yang F, Luo N, Lau T, Yu ZL, Foo MWY, Griva K. Health-related quality of life in patients treated with continuous ambulatory peritoneal dialysis and automated peritoneal dialysis in Singapore. Pharmacoecon Open. 2018;2(2):203-8. [CrossRef] [PubMed]
- Brekke FB, Amro A, Hortemo Osthus TB, Dammen T, Waldum B, Os I. Sleep complaints, depression and quality of life in Norwegian dialysis patients. Clin Nephrol. 2013;80(2):88-97. [CrossRef] [PubMed]
- Hanly P. Sleep disorders and end-stage renal disease. Curr Opin Pulm Med. 2008;14(6):543-50. [CrossRef] [PubMed]
- Edalat-Nejad M, Qlich-Khani M. Quality of life and sleep in hemodialysis patients. Saudi J Kidney Dis Transpl. 2013;24(3):514-8. [CrossRef] [PubMed]
- Turkmen K, Yazici R, Solak Y, et al. Health-related quality of life, sleep quality, and depression in peritoneal dialysis and hemodialysis patients. Hemodial Int. 2012;16(2):198-206. [CrossRef] [PubMed]
- Guney I, Solak Y, Atalay H, et al. Comparison of effects of automated peritoneal dialysis and continuous ambulatory peritoneal dialysis on health-related quality of life, sleep quality, and depression. Hemodial Int. 2010;14(4):515-22. [CrossRef] [PubMed]
- Eryavuz N, Yuksel S, Acarturk G, et al. Comparison of sleep quality between hemodialysis and peritoneal dialysis patients. Int Urol Nephrol. 2008;40(3):785-91. [CrossRef] [PubMed]
- Bro S, Bjorner JB, Tofte-Jensen P, et al. A prospective, randomized multicenter study comparing APD and CAPD treatment. Perit Dial Int. 1999;19(6):526-33. [PubMed]
- Eghbali M, Shahqolian N, Nazari F, Babaee S. Comparing problems of patients with chronic renal failure undergoing hemodialysis and peritoneal dialysis referring to medical university's hospitals. Iran J Nurs Midwifery Res. 2009;14(1):1-5.
- Losso RL, Minhoto GR, Riella MC. Sleep disorders in patients with end-stage renal disease undergoing dialysis: comparison between hemodialysis, continuous ambulatory peritoneal dialysis and automated peritoneal dialysis. Int Urol Nephrol. 2015;47(2):369-75. [CrossRef] [PubMed]
- Baldwin CM, Choi M, McClain DB, Celaya A, Quan SF. Spanish translation and cross-language validation of a sleep habits questionnaire for use in clinical and research settings. J Clin Sleep Med. 2012;8(2):137-46. [CrossRef] [PubMed]
- Johns MW. A new method for measuring daytime sleepiness: the Epworth sleepiness scale. Sleep. 1991;14(6):540-5. [CrossRef] [PubMed]
- Ferrer M, Vilagut G, Monasterio C, Montserrat JM, Mayos M, Alonso J. Measurement of the perceived impact of sleep problems: the Spanish version of the functional outcomes sleep questionnaire and the Epworth sleepiness scale. Med Clin (Barc). 1999;113(7):250-5. [PubMed]
- Ware JE,Jr, Sherbourne CD. The MOS 36-item short-form health survey (SF-36). I. Conceptual framework and item selection. Med Care. 1992;30(6):473-83. [CrossRef] [PubMed]
- Zúniga AM, Carrillo-Jiménez TG, Fos JP, Gandek B, Medina-Moreno M. Evaluación del estado de salud con la Encuesta SF-36: resultados preliminares en México. Salud Pública de México. 1999;41(2):110-8. [CrossRef] [PubMed]
- Brazier J, Roberts J, Deverill M. The estimation of a preference-based measure of health from the SF-36. J Health Econ. 2002;21(2):271-92. [CrossRef]
- Davison SN, Jhangri GS, Feeny DH. Comparing the health utilities index mark 3 (HUI3) with the short form-36 preference-based SF-6D in chronic kidney disease. Value Health. 2009;12(2):340-5. [CrossRef] [PubMed]
- Dehesa-Lopez E, Correa-Rotter R, Olvera-Castillo D, Gonzalez-Parra C, Baizabal-Olarte R. Clinical, dialytic, and laboratory factors associated with poor health-related quality of life in Mexican patients on hemodialysis. Rev Invest Clin. 2016;68(4):192-200. [PubMed]
- Kim JH, Duffy JF. Circadian rhythm sleep-wake disorders in older adults. Sleep Med Clin. 2018;13(1):39-50. [CrossRef] [PubMed]
- Klink M, Quan SF. Prevalence of reported sleep disturbances in a general adult population and their relationship to obstructive airways diseases. Chest. 1987;91(4):540-6. [CrossRef] [PubMed]
- Ohayon MM, Zulley J, Guilleminault C, Smirne S, Priest RG. How age and daytime activities are related to insomnia in the general population: consequences for older people. J Am Geriatr Soc. 2001;49(4):360-6. [CrossRef] [PubMed]
- Fukuhara S, Lopes AA, Bragg-Gresham JL, et al. Health-related quality of life among dialysis patients on three continents: the Dialysis Outcomes and Practice Patterns Study. Kidney Int. 2003;64(5):1903-10. [CrossRef] [PubMed]
- Jha V, Garcia-Garcia G, Iseki K, et al. Chronic kidney disease: global dimension and perspectives. Lancet. 2013;382(9888):260-72. [CrossRef] [PubMed]
- Wu AW, Fink NE, Marsh-Manzi JV, et al. Changes in quality of life during hemodialysis and peritoneal dialysis treatment: generic and disease specific measures. J Am Soc Nephrol. 2004;15(3):743-53. [CrossRef] [PubMed]
- de Wit GA, Merkus MP, Krediet RT, de Charro FT. A comparison of quality of life of patients on automated and continuous ambulatory peritoneal dialysis. Perit Dial Int . 2001;21(3):306-12. [PubMed]
- Caballero-Morales S, Trujillo-Garcia JU, Welsh-Orozco U, Hernandez-Cruz ST, Martinez-Torres J. Calidad de vida en pacientes con hemodiálisis, diálisis peritoneal continua ambulatoria y automatizada. Arch Med Fam. 2006;8(3):163-8.
Cite as: Reynaga-Ornelas L, Baldwin CM, Arcoleo K, Quan SF. Impact of sleep and dialysis mode on quality of life in a Mexican population. Southwest J Pulm Crit Care. 2019;18(5):122-34. doi: https://doi.org/10.13175/swjpcc017-19 PDF
Out of Center Sleep Testing in Ostensibly Healthy Middle Aged to Older Adults
Stuart F. Quan, M.D.1,2
Brandon J. Lockyer1
Salma Batool-Anwar, M.D., M.P.H.1
Daniel Aeschbach, Ph.D.1,3
1Division of Sleep and Circadian Disorders, Department of Medicine and Department of Neurology; Brigham and Women's Hospital and Division of Sleep Medicine, Harvard Medical School, Boston, MA
2Asthma and Airways Research Center, University of Arizona College of Medicine, Tucson, AZ
3Department of Sleep and Human Factors Research; Institute of Aerospace Medicine; German Aerospace Center; Cologne, 51147; Germany
Abstract
Background: Out of Center Sleep Testing (OCST) is used increasingly to diagnose obstructive sleep apnea (OSA). However, there are few data using OCST that quantify the amount of intrinsic apneic and hypopneic events among asymptomatic healthy persons, especially those who are elderly. This analysis reports the results of OCST in a small group of ostensibly healthy asymptomatic individuals.
Methods: The study population was comprised of ostensibly healthy middle-aged to elderly volunteers for studies of circadian physiology. Before undergoing an OCST, they were found to be free of any chronic medical or psychiatry condition by history, physical and psychologic examination and by a variety of questionnaires and laboratory tests.
Results: There were 24 subjects ranging in age from 55-70 years who had an OCST performed. Repeat studies were required in only 3 subjects. Over half the study population was over the age of 60 years (54.2% vs 45.8%); the majority were men (70.8%). The mean apnea hypopnea index (AHI) was 9.2 /hour with no difference between younger and older subjects. However, 11 had an AHI > 5 /hour. Five had an AHI >15 /hour and 2 had an AHI >40 /hour. Those with an AHI <15 /hour had a mean AHI of 4.4 /hour (95% CI:2.8-6.0 /hour).
Conclusions: Although OCST has a low failure rate, there is a high prevalence of intrinsic obstructive apnea and hypopnea in ostensibly healthy asymptomatic persons.
Introduction
Out of center sleep testing (OCST) is increasingly used instead of laboratory polysomnography (PSG) for the identification of persons with obstructive sleep apnea (OSA) (1). There have been a number of studies validating the use of OCST for this purpose (1). Consequently, large research studies now are using OCST to identify subjects with OSA for clinical trials or observational studies (2-4). Out of center sleep testing also may have a role in identifying the presence of unrecognized OSA in studies of asymptomatic normal individuals. Studies reporting on the frequency of apneic and hypopneic events in healthy individuals using current PSG monitoring techniques (5, 6) found surprisingly high prevalence rates of OSA. Similar reports using OCST also noted that OSA was common in asymptomatic volunteers, but many of these subjects still had chronic medical conditions (7, 8). Thus, there is little information on the prevalence of OSA using OCST, especially in those who are older without any co-morbidities.
In this report, we describe the results of OCST in a small group of middle-aged to older adults who were screened intensively to exclude the presence of chronic sleep and medical conditions. We hypothesized that in this group of ostensibly healthy adults the prevalence of OSA would be less than previously observed.
Methods
Potential subjects between 55 and 70 years of age were identified through public advertisements for volunteers to participate in a circadian physiology research study. The study was approved by the Partners Health Care Human Research Committee, and subjects gave written informed consent prior to their participation. Initially, 5,225 individuals were screened by telephone for medical and psychiatric exclusion criteria. Those who passed (n=90) were invited for an interview and more intensive screening which included a medical history, the Pittsburgh Sleep Quality Index (PSQI) (9), Epworth Sleepiness Scale (ESS) (10) the Berlin Questionnaire (11), blood and urine tests, an electrocardiogram, and a complete physical examination by a physician. In addition, a structured psychologic examination was conducted by a clinical psychologist along with completion of several psychological screening tests including the Geriatric Depression Scale (12), Mattis Dementia Rating Scale (13) and the Mini Mental Status Examination (14). Potential subjects also could not have worked at night for the previous 3 years or recently traveled across time zones. Those who were determined to be free from any acute or chronic medical or psychiatric condition including but not limited to obesity (body mass index, BMI < 30 kg/m2), medication use, hypertension, cardiovascular or pulmonary disease, neoplasia, and disorders of the gastrointestinal, renal, endocrine, metabolic or neurologic systems were asked to undergo an OCST.
The OCST was performed using the Embletta Gold (Embla Systems, Broomfield, CO), a Type III OCST device. The testing montage included nasal pressure, pulse oximetry, bilateral leg electromyography, and chest and abdominal inductance plethysmography. Subjects were instructed to sleep at their habitual hours during OCST. Procedure for determining lights out and lights on, sleep onset and sleep offset, and wake periods during OCST in the sleep, aging and circadian rhythm disorders is given in Appendix 1. Estimated total sleep time was ascertained by the scoring technologist on the basis of changes in the recorded signals indicative of sleep onset or offset and a questionnaire administered to the subject on the morning after the study (see online supplement for the protocol). Studies were scored for apneas, hypopneas and periodic limb movements according to the following criteria. An apnea was defined as > 90% amplitude decrease from baseline of the nasal pressure signal lasting ≥ 10 s. Hypopneas were scored if an event was at least 10 s in duration and if there was a clear amplitude reduction of the nasal pressure signal that was associated with an oxygen desaturation > 4%. Obstructive or central apneas were identified by the presence or absence of respiratory effort, respectively. The apnea hypopnea index (AHI) was calculated as the sum of all apneas and hypopneas divided by the estimated total sleep time. Periodic limb movements were identified using American Academy of Sleep Medicine criteria (15). The periodic limb movement index (PLMI) was computed as the sum of all periodic limb movements divided by the estimated total sleep time. All OCST recordings were scored by a registered polysomnographic technologist and reviewed by a board-certified sleep physician.
Six subjects who had successfully completed the circadian physiology protocol were invited again to enroll in a related protocol approximately 1-3 years later. They repeated the aforementioned screening procedures including a second OCST.
Paired and unpaired Student’s t-tests were used to compare means. Comparisons between proportions were performed using c2. Data are expressed as means ± SD or number and % of cases. Data were analyzed using IBM SPSS Statistics V24 (Armonk, NY).
Results
As shown in Table 1, there were 24 subjects who successfully underwent a screening OCST.

Their ages ranged from 55 to 70 years. Over half the study population was over the age of 60 years [13/24 (54.2 %) vs 11/24 (45.8%)], and the majority were men (70.8%). In 3 subjects, the initial OCST provided insufficient data and a repeat study was required. The mean AHI was 9.2 /hour overall and there were no differences between younger and older subjects. Notably, 11 subjects (46%) had an AHI greater than 5 /hour. Five (21%) had an AHI greater than 15 /hour and 2 subjects had an AHI greater than 40 /hour. Excluding subjects with an AHI ≥15 /hour yielded a mean AHI of 4.4 (95% CI: 2.8-6.0) /hour. Younger subjects had a higher BMI (27.1 ± 2.7 vs. 24.2 ± 3.5 kg/m2, p=0.036), tended to have a longer estimated total sleep time (9.2 ± 0.6 vs. 7.9 ± 2.1 hours, p=0.059), and a slightly lower average nocturnal oxygen saturation (94.9 ± 1.4 vs. 96.1 ± 1.4%, p=.061). No other differences were observed between young and older subjects.
In Table 2 are shown the sleep and anthropometric findings for the 6 subjects who had repeat testing.

The interval between tests ranged from 382 to 930 days (mean: 672 ± 227 days). Although there was a slight increase in BMI over this interval, no changes were noted in their sleep quality, AHI or PLMI.
Discussion
In this study, we found that it was feasible to screen an ostensibly healthy asymptomatic group of middle to older aged adults for the presence of OSA using a Level III OCST device. The results of the OCST were replicable over an interval of several years and there were few technical failures. Furthermore, evidence of OSA was observed in a substantial proportion of these individuals underscoring that the diagnosis of OSA remains unrecognized in many elderly persons.
Over the past 20 years, there have been numerous clinical trials and cohort studies that have recorded data related to the presence of OSA (2-4, 8, 16, 17). Most have used PSG recorded in the laboratory or at home (16-18). However, the use of PSG is logistically complex and expensive. Additionally, the equipment required for data acquisition may artifactually disrupt the subject’s sleep. In contrast, OCST is less intrusive and expensive, but actual sleep is not recorded. However, to our knowledge there have not been previous studies that have determined the normative values for the AHI using OCST in a group of ostensibly healthy middle-aged to older adults. In this small cohort, the mean AHI was 9.2 /hour. According to the 3rd International Classification of Sleep Disorders (19), an AHI ≥15 /hour is diagnostic of OSA even in the absence of symptoms or associated medical conditions. Therefore, after excluding those who met criteria for at least moderate OSA (i.e., AHI ≥15 hour), our findings indicate an average value of 4.4 /hour in those individuals with a “normal” AHI using OCST. In contrast, a previous study of healthy volunteers for circadian physiology research using similar inclusion and exclusion criteria found the overall mean AHI of all subjects using PSG was substantially higher; hypopneas were identified if reductions in airflow were associated with a minimum 3% oxygen desaturation or a cortical arousal (6). However, a more recent study also using PSG found AHI values more similar to our observations (5). Although it would be expected that OCST may underreport the presence of hypopneas, the explanation for the differences between the two PSG studies is unclear given that the recording montages and respiratory scoring algorithms appeared to be similar.
A striking finding from this study is the high prevalence of OSA among these carefully screened, ostensibly healthy volunteers who had no evidence of a sleep disorder based on their Berlin Questionnaire, PSQI and ESS. The AHI of 2 subjects documented the presence of severe OSA which is usually an indication for treatment. The absence of hypersomnia in a substantial proportion of persons with PSG evidence of OSA has been clearly documented (20). Our data extend these observations by demonstrating the existence of severe OSA in ostensibly healthy middle-aged to older adults. Although some data suggest that such individuals are not at risk for cardiovascular disease or other sequelae of OSA (8), whether this prognosis is correct is still not settled.
Some, but not all epidemiologic data suggest that OSA slowly worsens with age. In contrast, we observed no progression of OSA over an interval of approximately 1-2.5 years (8, 21). However, it is likely that our follow up interval was insufficient to detect a change given the small number of subjects.
In conclusion, use of OCST to screen for OSA is feasible in research studies of normal individuals. Importantly, a relatively high proportion of even ostensibly healthy individuals can be expected to show evidence of OSA.
Acknowledgements
This study was supported by P01 AG009975 from the National Institute of Aging. We would like to express our gratitude to Alec Rader and Jacob Medina for their help with subject recruitment and Stephanie Marvin for scoring support.
References
- Kapur VK, Auckley DH, Chowdhuri S, et al. Clinical Practice Guideline for Diagnostic Testing for Adult Obstructive Sleep Apnea: An American Academy of Sleep Medicine Clinical Practice Guideline. J Clin Sleep Med. 2017;13(3):479-504. [CrossRef] [PubMed]
- Gottlieb DJ, Punjabi NM, Mehra R, et al. CPAP versus oxygen in obstructive sleep apnea. N Engl J Med. 2014;370(24):2276-85. [CrossRef] [PubMed]
- Zhao YY, Wang R, Gleason KJ, et al. Effect of Continuous Positive Airway Pressure Treatment on Health-Related Quality of Life and Sleepiness in High Cardiovascular Risk Individuals with Sleep Apnea: Best Apnea Interventions for Research (BestAIR) Trial. Sleep. 2017;40(4):10.1093/sleep/zsx040. [CrossRef] [PubMed]
- Redline S, Sotres-Alvarez D, Loredo J, et al. Sleep-disordered breathing in Hispanic/Latino individuals of diverse backgrounds. The Hispanic Community Health Study/Study of Latinos. Am J Respir Crit Care Med. 2014;189(3):335-44. [CrossRef] [PubMed]
- Mitterling T, Hogl B, Schonwald SV, et al. Sleep and Respiration in 100 Healthy Caucasian Sleepers--A Polysomnographic Study According to American Academy of Sleep Medicine Standards. Sleep. 2015;38(6):867-75. [CrossRef] [PubMed]
- Pavlova MK, Duffy JF, Shea SA. Polysomnographic respiratory abnormalities in asymptomatic individuals. Sleep. 2008;31(2):241-8. [CrossRef] [PubMed]
- Sforza E, Pichot V, Martin MS, Barthelemy JC, Roche F. Prevalence and determinants of subjective sleepiness in healthy elderly with unrecognized obstructive sleep apnea. Sleep Med. 2015;16(8):981-6.[CrossRef] [PubMed]
- Sforza E, Hupin D, Pichot V, Barthelemy JC, Roche F. A 7-year follow-up study of obstructive sleep apnoea in healthy elderly: The PROOF cohort study. Respirology. 2017;22(5):1007-14. [CrossRef] [PubMed]
- Buysse DJ, Reynolds CF,3rd, Monk TH, Berman SR, Kupfer DJ. The Pittsburgh Sleep Quality Index: a new instrument for psychiatric practice and research. Psychiatry Res. 1989;28(2):193-213. [CrossRef] [PubMed]
- Johns MW. A new method for measuring daytime sleepiness: the Epworth sleepiness scale. Sleep. 1991;14(6):540-5. [CrossRef] [PubMed]
- Netzer NC, Stoohs RA, Netzer CM, Clark K, Strohl KP. Using the Berlin Questionnaire to identify patients at risk for the sleep apnea syndrome. Ann Intern Med. 1999;131(7):485-91.[CrossRef] [PubMed]
- Yesavage JA, Brink TL, Rose TL, et al. Development and validation of a geriatric depression screening scale: a preliminary report. J Psychiatr Res. 1982;17(1):37-49. [CrossRef] [PubMed]
- Mattis S. Mental status examination for organic mental syndrome in the elderly patient. In: Geriatric psychiatry. Bellak L and Karasu TE, eds. New York: Grune and Stratton, 1976; 77-121
- Pangman VC, Sloan J, Guse L. An examination of psychometric properties of the mini-mental state examination and the standardized mini-mental state examination: implications for clinical practice. Appl Nurs Res. 2000;13(4):209-213. [CrossRef] [PubMed]
- Iber C, Ancoli-Israel S, Chesson A, Quan SF. The AASM Manual for the Scoring of Sleep and Associated Events: Rules, Terminology and Technical Specifications. 1st ed. Westchester, IL: American Academy of Sleep Medicine, 2007; 57.
- Quan SF, Howard BV, Iber C, et al. The Sleep Heart Health Study: design, rationale, and methods. Sleep. 1997;20(12):1077-85. [PubMed]
- Kushida CA, Nichols DA, Quan SF, et al. The Apnea Positive Pressure Long-term Efficacy Study (APPLES): rationale, design, methods, and procedures. J Clin Sleep Med. 2006;2(3):288-300. [PubMed]
- Chen X, Wang R, Zee P, et al. Racial/Ethnic Differences in Sleep Disturbances: The Multi-Ethnic Study of Atherosclerosis (MESA). Sleep. 2015;38(6):877-88. [CrossRef] [PubMed]
- Sateia MJ. International Classification of Sleep Disorders. 3rd ed. Darien, IL: American Academy of Sleep Medicine, 2014.
- He K, Kapur VK. Sleep-Disordered Breathing and Excessive Daytime Sleepiness. Sleep Med Clin. 2017;12(3):369-82.[CrossRef] [PubMed]
- Redline S, Schluchter MD, Larkin EK, Tishler PV. Predictors of longitudinal change in sleep-disordered breathing in a nonclinic population. Sleep. 2003;26(6):703-9. [CrossRef] [PubMed]
Cite as: Quan SF, Lockyer BJ, Batool-Anwar S, Aeschbach D. Out of center sleep testing in ostensibly healthy middle aged to older adults. Southwest J Pulm Crit Care. 2019;18:87-93. doi: https://doi.org/10.13175/swjpcc016-19 PDF
Sleep Related Breathing Disorders and Neurally Mediated Syncope (SRBD and NMS)
Damian Valencia, MD1
Stella Pak, MD1
Juan Linares, MD1
Victor Valencia, BS2
Christopher Lee, MD1
John-Philip Markovic, MD1
Hemant Shah, MD1
1Department of Medicine, Kettering Medical Center, Kettering, Ohio USA
2Department of Medicine, Northwestern University Feinberg School of Medicine, Chicago, Illinois USA
Abstract
Introduction: Individuals with severe sleep related breathing disorders (SRBD) tend to experience intermittent hypoxia, sleep fragmentation and highly fluctuating intrathoracic pressures. Chronic exposure to these stressors sensitizes the parasympathetic system while suppressing the sympathetic system. Parasympathetic over-reactivity among patients with severe sleep related breathing disorders has been proposed as a predisposing factor for neurally mediated syncope.
Goal: We sought to determine the relative risk for neurally mediated syncope in patients with severe SRBD compared to the general population.
Methods: This is a retrospective cohort study of 228 cases selected from 2,598 patients who were referred for polysomnography on discharge from hospitalization. Incidence of neurally mediated syncope (NMS) was compared between patients with apnea-hypopnea-index (AHI) scores of 30 or greater and those with an AHI score below 5.
Results: Approximately 32% of patients with severe SRBD had a history of neurally mediated syncope compared to only 14% in patients with normal sleep breathing patterns (OR = 3.09, 95% CI: 1.25 - 7.62, p = 0.015).
Conclusion: Our multi-center retrospective study supports an association between SRBD and NMS.
Brief Summary
Current Knowledge/Study Rational. There are multiple reports that highlight a possible connection between sleep related breathing disorders and neurally mediated syncope. Deleterious effects on the autonomic and peripheral nervous system by severe sleep related breathing disorders have also been demonstrated. We sought to determine the association and relative risk of neurally mediated syncope in patients with severe sleep related breathing disorders.
Study Impact. Patients with severe sleep related breathing disorders are at increased risk for neurally mediated syncope. Early identification and appropriate treatment in this patient population may reduce rates of syncope, improve quality of life and clinical outcomes.
Introduction
Sleep related breathing disorders (SRBD), comprise a spectrum of disorders characterized by chronic intermittent apnea and hypopnea, which includes obstructive sleep apnea (OSA), central sleep apnea, sleep-related hypoventilation, and nocturnal hypoxemia (1). Neurally mediated syncope (NMS), also known as reflex syncope, is defined as a transient loss of consciousness secondary to decreased cerebral blood supply, typically as a result of reflexive cardiac inhibition and decreased vascular tone. NMS includes vasovagal syncope, situational syncope and carotid sinus syncope (2). Autonomic dysfunction may also play a role in cases of NMS (3). Researchers have previously documented the deleterious effects of SRBD on the autonomic and peripheral nervous system (4-7). A connection between SRBD and NMS has been proposed by some, detailing cases of patients suffering from incapacitating recurrent syncope which demonstrates dramatic improvement or resolution after diagnosis and treatment of OSA (8-10). In this study, we sought to determine the association and relative risk of neurally mediated syncope in patients with severe sleep related breathing disorders.
Methods
This retrospective cohort analysis was performed using electronic medical record data collection from hospitals within the Kettering Health Network, including Fort Hamilton Hospital (Hamilton, Ohio), Grandview Medical Center (Dayton, Ohio), Greene Memorial Hospital (Xenia, Ohio), Kettering Medical Center (Kettering, Ohio), Soin Medical Center (Beavercreek, Ohio), Southview Medical Center (Centerville, Ohio) and Sycamore Medical Center (Miamisburg, Ohio). Individuals who underwent and completed in-facility polysomnography were selected for study review. Patients under the age of 18 years old and those with a pacemaker or implantable cardiac defibrillator were excluded from the study. Patients were divided into two groups; those with severe SRBD, defined as having an Apnea-Hypopnea Index (AHI) score of/ or greater than 30, and a control group, defined as patients having an AHI score of/ or less than 5. This study was approved by the institutional review board (IRB) at Kettering Health Network.
Statistical Methods: The Kolmogorov-Smirnov and Shapiro-Wilk tests were utilized to compare baseline patient demographics between each group; control and severe SRBD group. These tests were selected to better represent the data, with median interquartile range (IQR), as outliers were included in the analysis. Categorical variables were compared using Pearson’s Chi-squared test. Continuous variables were compared using the Student’s t-test or Wilcoxon rank sum test (Mann-Whitney U test). All estimates were reported as 95% confidence intervals with p-values. Two-sided p-values less than 0.05 were considered statistically significant. Multivariate logistic regression modeling was used to determine the effects of each variable while controlling for confounding variables. Odds ratios (OR) were calculated for each type of syncope in both the severe SRBD group and control group. All statistical analyses were performed using IBM SPSS Statistics for Windows version 20.0 (IBM Corp., Armonk, NY, USA).
Results
A total of 2,598 patients were identified from the electronic medical record database, of which, only 228 patients fulfilled our inclusion criteria for severe SRBD (AHI score of/ or greater than 30), with 80 patients meeting criteria for the control group (AHI score of/ or less than 5). Among the 228 patients with severe SRBD, the most common subtype was obstructive sleep apnea (204 of 228 patients, 89.5%), followed by central sleep apnea (13 of 228 patients, 4.2%) and mixed type (11 of 228 patients, 3.6%).
Initial comparison of demographic characteristics (Table 1) was done using univariate analysis.
Table 1: Baseline Characteristics of the Individuals with and without SRBD.

SRBD: sleep-related breathing disorder, IQR: interquartile range; BMI: body-mass index; AHI: apnea-hypopnea index; LEVF: left ventricular ejection fraction; COPD: chronic obstructive pulmonary disease; N: number; N/A: not applicable.
The SRBD group and control did not statistically significance differ in age (p = 0.79). Although gender differences were noted, 62.3% male in the SRBD group compared to 47.5% in the control group (p = 0.042), there were no statistically significant differences on multivariate logistic regression (p = 0.854). Differences in body mass index (BMI) between groups were noted on univariate (p = 0.042) and multivariate models (p = 0.041), with 36.5 (IQR 31.3 – 43.8) mean BMI of the SRBD group compared to 34.4 (IQR 27.3 – 40.4) in the control group.
The incidence of pre-existing comorbidities between groups was also compared. (Table 1) There were no statistically significant differences between the groups in terms of pulmonary artery pressure (p = 0.226), diabetes (p = 0.902) and coronary artery disease (p = 0.065). Univariate analysis did reveal differences amongst left ventricular ejection fraction (LVEF), 31.1% of patients with SRBD had LVEF <55% compared to only 17.5% in the control group (p = 0.19), hypertension (HTN), 75.4% of patients with SRBD had HTN compared to only 53.8% in the control group (p < 0.001), and chronic obstructive pulmonary disease (COPD), 29.8% of patients with SRBD compared to 43.8% in the control group (p = 0.023). These findings were not statistically significant on multivariate logistic regression; LVEF<55% (p = 0.326), HTN (p = 0.585), COPD (p = 0.576).
The mean apnea hypopnea index (AHI) for the severe SRBD group was 53.2 (38.7-80.2), compared to 1.6 (0-2.6) in the control group (p < 0.001). The prevalence of NMS was higher in the SRBD group compared to the control group, 32% (73 of 228 patients) and 14% (11 of 80 patients), respectively; χ2 (2, N=308) = 9.96, p = 0.001. Prevalence of non-neurally mediated syncope did not differ significantly between the SRBD group and control group, 1% (2 of 228 patients) and 0% (no patients), respectively; Pearson’s Chi-squared test p = 0.571. Approximately 32% of patients with severe SRBD had a history of neurally mediated syncope compared to only 14% in patients with normal sleep breathing patterns (OR = 3.09, 95% CI: 1.25 - 7.62, p = 0.015). (Table 2).
Table 2: Multivariate Logistic Regression Modeling, Odds Ratio (OR) for Neurally Mediated Syncope.

CI: confidence interval; BMI: body mass index; AHI: apnea-hypopnea index; LEVF: left ventricular ejection fraction; COPD: chronic obstructive pulmonary disease.
Situational syncope has not been consistently recorded, OR and CI were not calculated.
Discussion
This study suggests that individuals with severe sleep related breathing disorders are at increased risk for developing neurally mediated syncope. Chrysostomakis et al. (11) showed that parasympathetic activity is increased during the night in patients with obstructive sleep apnea and that continuous positive airway pressure (CPAP) treatment may restore autonomic balance. Puel et al. (8) suggested that intermittent hypoxia, sleep fragmentation and variations of intra-thoracic pressures may result in chronic adaptations to the autonomic nervous system, which may predispose patients to vasovagal syncope. Cintra et al. (12) noted that patients with vasovagal syncope exhibited sympathetic suppression during rapid eye movement (REM) sleep. Previous studies indicate that chronic intermittent hypoxia can also increase activation of free-radical oxidation, which in turn can elicit rapid and sustained expression of pro-inflammatory cytokines (12). This oxidative stress and inflammatory response can induce tissue damage and intermittent academia, eventually leading to up-regulation of pH sensitive ion channels on chemo-afferent neurons at the carotid bodies. Overexpression of these channels potentiates the carotid body response to changes in arterial oxygen saturation (12). It is possible that this mechanism also contributes to the higher prevalence of carotid sinus hypersensitivity and syncope among patients with severe SRBD. In accordance with our findings, there have been reported cases of recurrent syncope, which have resolved with correction of underlying SRBD (8-10). Appropriate management of SRBD in this patient population may reduce rates of NMS. Given the high prevalence of SRBD and neurally mediated syncope in the United States, further investigation is warranted to delineate the association between the two disease processes and the mechanisms which are involved.
Study Limitations
Our retrospective study design has limited control over consistency and accuracy. This study did not use any matching algorithm to match the control group to the individuals with severe SRBD for baseline characteristics. We did not utilize a caliper matching process to identify controls, and as a result, the control cohort was smaller than the study cohort. The diagnosis of vasovagal syncope was made based on clinical presentation. All patients who were diagnosed with vasovagal syncope did not have confirmatory tilt-table testing, limiting diagnostic accuracy and consistency.
Conclusion
Our study suggests that individuals with severe sleep-related breathing disorders (SRBD) are approximately 3 times (OR = 3.09, 95% CI: 1.25 - 7.62, p = 0.015) more likely to have experienced neurally mediated syncope (NMS) compared to case matched controls.
Acknowledgement
Rosaria Jordan (table/figure formatting)
References
- Tsara V, Amfilochiou A, Papagrigorakis M, Georgopoulos D, Liolios E. Guidelines for diagnosis and treatment of sleep-related breathing disorders in adults and children. Definition and classification of sleep related breathing disorders in adults: Different types and indications for sleep studies (part 1). Hippokratia. 2009;13:187-91. [PubMed]
- Alboni P, Brignole M, Menozzi C, et al. Diagnostic value of history in patients with syncope with or without heart disease. J Am Coll Cardiol. 2001;37(7):1921-8. [CrossRef] [PubMed]
- Mosqueda-Garcia R, Furlan R, Tank J, Fernandez-Violante R. The elusive pathophysiology of neurally mediated syncope. Circulation. 2000;102(23):2898-2906. [CrossRef] [PubMed]
- Li Y, Veasey SC. Neurobiology and neuropathophysiology of obstructive sleep apnea. NeuroMolecular Med. 2012;14(3):168-179. doi:10.1007/s12017-011-8165-7. [CrossRef] [PubMed]
- Gozal D, Daniel JM, Dohanich GP. Behavioral and anatomical correlates of chronic episodic hypoxia during sleep in the rat. J Neurosci. 2001;21(7):2442-50. [PubMed]
- Mayer P, Dematteis M, Pépin JL, et al. Peripheral neuropathy in sleep apnea: A tissue marker of the severity of nocturnal desaturation. Am J Respir Crit Care Med. 1999;159(1):213-9. [CrossRef] [PubMed]
- Dziewas R, Schilling M, Engel P, et al. Treatment for obstructive sleep apnoea: effect on peripheral nerve function. J Neurol Neurosurg Psychiatry. 2007;78(3):295-7. [CrossRef] [PubMed]
- Puel V, Pepin JL, Gosse P. Sleep related breathing disorders and vasovagal syncope, a possible causal link? Int J Cardiol. 2013;168(2):1666-7. [CrossRef] [PubMed]
- Barone D, Fine L, Bhandari N, Ana C. Syncope in hypoxemic respiratory arrest. J Sleep Med Disord. 2015;2(2):2-4. [CrossRef].
- Willis FB, Isley AL, Geda YE, Shaygan A, Quarles L, Fredrickson P a. Resolution of syncope with treatment of sleep apnea. J Am Board Fam Med. 2008;21(5):466-8. [CrossRef] [PubMed]
- Chrysostomakis SI, Simantirakis EN, Schiza SE, et al. Continuous positive airway pressure therapy lowers vagal tone in patients with obstructive sleep apnoea-hypopnoea syndrome. Hell J Cardiol. 2006;47(1):13-20. [PubMed]
- Cintra F, Poyares D, DO Amaral A, et al. Heart rate variability during sleep in patients with vasovagal syncope. Pacing Clin Electrophysiol. 2005;28(12):1310-6. [CrossRef] [PubMed]
Cite as: Valencia D, Pak S, Linares J, Valencia V, Lee C, Markovic J-P, Shah H. Sleep related breathing disorders and neurally mediated syncope (SRBD and NMS). Southwest J Pulm Crit Care. 2019;18(4):76-81. doi: https://doi.org/10.13175/swjpcc015-19 PDF
Sleep Board Review Question: Restless Legs
Olabimpe Omobomi, MD MPH
Rohit Budhiraja, MD
Olabimpe Omobomi, MD MPH
Rohit Budhiraja, MD
Division of Sleep Medicine
Brigham and Women’s Hospital
Harvard Medical School
Boston, MA USA
Ms. Jones (not her real name) is a 63-year-old woman who states that she gets very fidgety when sitting in a theater, watching a movie or when flying long distances on a plane. She is unable to find words to describe the sensation but she states that moving her legs make them feel better. Lately, she has been getting this feeling almost every night. She reports no leg discomfort in the daytime.
She denies muscle cramps her legs. She had some recent investigations done by her primary care physician because of complaints of fatigue.
Which of the following will be helpful in the diagnosis and management in this patient? (Click on the correct answer for an explanation-no penalty for guessing, you can go back and try again)
- An overnight polysomnogram showing apnea hypopnea index of 1.6 events per hour and no periodic limb movements (PLMs)
- Ferritin level of 18 ng/ml (normal range 20-200 ng/ml)
- Serum Bicarbonate of 29 mEq/L (normal range 23-29 mEq/L)
- Thyroid Stimulating hormone (TSH) 6 mIU/ml (normal range 0.4-4.8 mIU/ml)
Cite as: Omobomi O, Budhiraja R. Sleep board review question: restless legs. Southwest J Pulm Crit Care. 2018;16(2):81-2. doi: https://doi.org/10.13175/swjpcc028-18 PDF
Impact of Sleep Duration and Weekend Oversleep on Body Weight and Blood Pressure in Adolescents
*Division of Sleep and Circadian Disorders, Brigham and Women’s Hospital, Harvard Medical School, Boston, MA USA
†Asthma and Airways Research Center, University of Arizona College of Medicine, Tucson, AZ USA
‡Department of Pediatrics, University of Arizona College of Medicine, Tucson, AZ USA
§Department of Medicine, University of Arizona College of Medicine, Tucson, AZ USA
¶ Center for Sleep and Circadian Sciences, University of Arizona Health Sciences Center, Tucson, AZ USA
Stuart F. Quan, M.D.*†
Daniel Combs, M.D.‡ ¶
Sairam Parthasarathy, M.D.†§ ¶
*Division of Sleep and Circadian Disorders, Brigham and Women’s Hospital, Harvard Medical School, Boston, MA USA
†Asthma and Airways Research Center, University of Arizona College of Medicine, Tucson, AZ USA
‡Department of Pediatrics, University of Arizona College of Medicine, Tucson, AZ USA
§Department of Medicine, University of Arizona College of Medicine, Tucson, AZ USA
¶ Center for Sleep and Circadian Sciences, University of Arizona Health Sciences Center, Tucson, AZ USA
Abstract
Introduction: Weekend oversleep or catchup sleep is a frequent occurrence in children, but there are relatively little data concerning its impact on weight and blood pressure. The aim of this study was to assess the association between sleep duration and oversleep, and weight and blood pressure in adolescents.
Methods: Sleep duration, weight and blood pressure of 327 children (51.4% boys, mean age 13.3 + 1.7 years) who had polysomnograms performed during both exam cycles of the Tucson Children’s Assessment of Sleep Apnea study (TuCASA) were analyzed. Sleep duration on school nights and non-school nights was used to compute a weighted average of child and parent reported overall sleep duration respectively. Oversleep was defined as the difference between self and parent reported weekend sleep and weekday sleep separately. Simple correlations between overall sleep duration, sleep on school and non-school nights and oversleep, and blood pressure, standardized body mass index (BMI), snoring, respiratory disturbance index (RDI) and age were calculated. Significant bivariate associations then were used to develop multivariate partial correlation models.
Results: Unadjusted negative correlations with BMI were noted for parent reported total sleep duration at the 1st exam cycle, parent and child reported total sleep and school night sleep duration, and parent reported non-school night sleep duration at the 2nd exam cycle. Additionally, for BMI, positive correlations were observed for log RDI at both exam cycles and snoring at the 2nd exam cycle. For blood pressure, there were positive associations with age, parent reported oversleep, caffeine consumption and snoring. Additionally, for blood pressure, negative relationships were observed with parent reported total sleep duration at the 1st exam cycle, and parent and child reported total sleep and school night sleep durations at the 2nd exam cycle. Partial correlations found that BMI was negatively correlated with parent reported total sleep duration at the 1st exam cycle and parent reported total sleep duration at the 2nd exam cycle, and positively correlated with snoring and log RDI at both exam cycles. Systolic blood pressure was only associated with age and snoring. Diastolic blood pressure was positively correlated with age and caffeine consumption, and negatively correlated with parent reported total and school night sleep duration. Oversleep and child reported sleep duration were not represented in any of these models.
Conclusion: Lower amounts of sleep especially on school nights is associated with higher body weight and blood pressure. Oversleep was not associated with either body weight or blood pressure.
Introduction
Insufficient sleep in children is associated an increased likelihood of negative behavioral and physical health consequences (1). In particular, short sleep duration has been linked to weight gain and greater risk of obesity, (2-5) and hypertension (6-9). Sleep disordered breathing (SDB) in children also has been implicated as a factor in elevations in blood pressure (10-13). Therefore, it is unclear whether sleep duration and SDB are independent risk factors for this condition.
Weekend oversleep occurs when sleep on weekends exceeds sleep occurring on weekdays. Recently, it was observed in children that greater amounts oversleep were associated with a reduced likelihood of being overweight (4). It was suggested that oversleep represented a compensatory behavior in children for insufficient sleep during weeknights and that it was protective against the deleterious impact of inadequate sleep. Similarly, in adults, oversleep has been associated with a decreased risk of hypertension (14). However, there have been no previous studies of the relationship between oversleep and blood pressure in children.
The Tucson Children’s Assessment of Sleep Apnea Study (TuCASA) was a longitudinal cohort study to assess the impact of SDB on a variety of physiologic and behavioral endpoints (15). The goal of this analysis was to examine whether sleep duration, SDB and oversleep were associated with weight and blood pressure in adolescent children in a general population cohort as represented by TuCASA.
Methods
Subjects and Study Design: Details of the TuCASA study design have been published previously (15, 16). Briefly, 6-11 year-old Hispanic and Caucasian children from the Tucson Unified School District (TUSD) were recruited to undergo unattended home polysomnography. In addition, demographic and anthropometric information was obtained and a neurocognitive assessment performed. From 1999-2004, 503 children aged 6-11 years completed home polysomnograms (Exam Cycle 1). Approximately five years later (Exam Cycle 2, mean 4.7 years), 348 children participated in the second phase of the study; 319 children had home visits where acceptable in-home polysomnography was completed a second time. On both occasions, all of the families completed sleep screening, sleep habits, and morning questionnaires. At the time of the second phase of the study, a comprehensive dietary and physical activity assessment was performed as well (17). The TuCASA study was approved by the University of Arizona Institutional Review Board (IRB) as well as the TUSD Research Committee.
Data collection: The methods for obtaining data have been previously described (11, 15, 16). In brief, for both exam cycles, a two person team arrived at the home approximately one hour before the child’s normal bedtime. Prior to performing any study procedures, parents gave informed consent and the child gave assent to the study using language appropriate forms approved by the IRB. Each child’s height, weight, neck circumference, and blood pressure were measured. One parent was asked to complete a comprehensive Sleep Habits Questionnaire (SHQ) that inquired about their child’s sleep history, sleep characteristics and additional questions regarding parental health including smoking status. For the 2nd exam cycle, the child was asked to complete a SHQ, and a dietary and physical activity questionnaire as well.
Parent and Child Reported Sleep Durations: The SHQ for both parent and child inquired about hours of sleep on school nights and non-school nights. Overall parent and child sleep durations were estimated by computing a weighted average ([school night sleep x 5] + [non-school night sleep x 2] / 7).
Blood Pressure (BP): After a few minutes of rest while seated, the child’s BP was measured in triplicate from the right arm using a portable mercury sphygmomanometer and standardized techniques. The appropriate BP cuff was selected according to the measured arm size (upper arm circumferences of 6-15 cm, infant cuff, 16-22 cm, child cuff, and 23-30 cm, regular-sized adult cuff). The initial cuff inflation pressure was determined by adding 30 mm Hg to the palpated systolic BP. Cuff deflation was at 2 mm/second. At least 30 seconds elapsed between each of the 3 successive measurements. The mean of the final 2 of 3 BP measurements was used for the analyses in this report. Blood pressure percentiles based on height, age and gender were calculated using data from the Centers for Disease Control (CDC) (18).
Obesity: Height was obtained using a folding ruler on a level surface after removal of shoes, and the head in the Frankfort plane. Weight was measured on a platform scale. A standardized BMI z score was calculated using an equation from the CDC which adjusted for age, sex and ethnicity (http://www.cdc.gov/nccdphp/dnpao/growthcharts/resources/sas.htm).
Polysomnography: A single, unattended overnight polysomnogram was obtained using the Compumedics PS-2 system (Abbotsford, Victoria, Australia). The following signals were acquired as part of the TuCASA montage: C3/A2, C4/A1 electroencephalogram (EEG), right and left electrooculogram, a bipolar submental electromyogram, thoracic and abdominal displacement (inductive plethysmography), airflow (nasal/oral thermistor), nasal pressure cannula, finger pulse oximetry, ECG (single bipolar lead), snoring microphone, body position (Hg gauge sensor), and ambient light (sensor attached to the vest to record on/off).
Scoring of the polysomnograms was performed by a single registered polysomnographic technologist using Rechtschaffen and Kales criteria (19). Apneas were scored if the amplitude (peak to trough) of the airflow signal using the thermistor decreased below at least 25% of the amplitude of baseline breathing (identified during a period of regular breathing with stable oxygen levels), if this change lasted for more than 6 seconds or 2 breath cycles. Hypopneas were designated if the amplitude of any respiratory signal decreased below (approximately) 70% of the amplitude of baseline and if the thermistor signal did not meet the criterion for apnea. Central events were marked if no displacement was noted on both the chest and abdominal inductance channels. However, central events that occurred after movement were not included. Otherwise, events were scored as obstructive. After full scoring, analysis software was used to link each event to data from the oxygen saturation and EEG channels. The Respiratory Disturbance Index (RDI) was defined as the number of respiratory events (apneas and hypopneas) per hour of the total sleep time. For this analysis, a 3% oxygen desaturation was required for an event to be counted in the total RDI.
Data: AnalysisDescriptive data are presented as mean + standard deviation (SD) or as percentages. The distributions of RDI and mg caffeine consumption were skewed with some children having values of zero. Therefore, RDI at both exam cycles and caffeine consumption were log transformed. To adjust for zero values, a small number (0.01) was added to each value before the log transformation. Analyses of RDI and caffeine consumption were subsequently performed using log transformed values.
To determine the relationships between the physiologic attributes of weight and blood pressure at the 2nd exam cycle, and variables representing sleep duration, sleep disordered breathing, and caffeine consumption and age, Pearson correlation coefficients were computed. Incorporating only those variables that demonstrated significant bivariate correlations, multivariate models were constructed by calculating partial correlations. Analyses were performed using IBM SPSS Statistics, V24.
Results
There were 327 children (51.4% boys, mean age 13.3+ 1.7 years) who had PSGs performed during both TuCASA exam cycles. In comparison to children who only participated in the 1st exam cycle, there were no differences with respect to age, standardized BMI, RDI, sleep duration on school nights and non-school nights and 1st exam cycle systolic blood pressure (data not shown). However, 1st exam cycle diastolic blood pressure was slightly higher in those who participated in both exam cycles (60.5 + 9.5 vs. 58.4 + 10.3 mmHg, p<0.05).
Analyses of the relationships of household smoking with BMI and blood pressure showed no differences between children living in households with smokers and those with non-smokers. Similarly, there were no associations with physical activity (data not displayed).
Shown in Table 1 are mean values for sleep, anthropometric and blood pressure variables.
Table 1: Mean Values for Sleep, Anthropometric and Blood Pressure Data.*

Of note is that parent reported sleep duration declined from the 1st (9.6+0.8 hours) to the 2nd exam cycle (8.9+0.9 hours). Parent reported sleep durations (overall, school night, non-school night and oversleep) were greater than corresponding child reported values.
Unadjusted correlations between standardized BMI and blood pressure, and sleep duration metrics, log RDI, age, caffeine consumption and snoring are provided in Table 2.
Table 2. Unadjusted Correlations with BMI and Blood Pressure.

For standardized BMI, significant negative associations with standardized BMI were present for parent reported total sleep duration at the 1st exam cycle, parent and child reported total sleep and school night sleep duration, and parent reported non-school night sleep duration at the 2nd exam cycle. Additionally, for standardized BMI, positive correlations were observed for log RDI at both exam cycles and snoring at the 2nd exam cycle. For blood pressure, there were positive associations with age, caffeine consumption, oversleep and snoring. Additionally, for blood pressure, negative relationships were observed with parent reported total sleep duration at the 1st exam cycle, and parent and child reported total sleep and school night sleep durations at the 2nd exam cycle.
Partial correlations representing multivariate models including only those variables with significant univariate correlations are shown in Table 3.
Table 3. Partial Correlations with BMI and Blood Pressure.

Standardized BMI was negatively correlated with parent reported total sleep duration at the 1st exam cycle, parent reported total sleep duration at the 2nd exam cycle, and positively correlated with snoring and log RDI at both exam cycles. Parent reported school night sleep duration exhibited multicollinearity with other sleep duration metrics. Systolic blood pressure was only associated with age and snoring. Diastolic blood pressure was positively correlated with age and weakly positively correlated with caffeine consumption. It also was weakly negatively correlated with parent reported total and school night sleep duration. Analyses using blood pressure expressed as gender, age and height-adjusted percentiles yielded similar findings (data not shown). Oversleep was not represented in any of these models.
Discussion
The major findings from this analysis were that sleep duration was inversely associated with BMI and to a lesser extent with blood pressure. However, there was no association between oversleep and BMI or blood pressure. Thus, overall sleep duration, but not oversleep, is an important behavioral factor affecting body weight and blood pressure in children.
We observed that parent reported sleep duration overall was inversely correlated with BMI. Our findings are consistent with previous studies that have also found that less sleep in children is associated with greater body weight (2, 3, 5). However, our observation that there was collinearity with parent reported school night sleep duration emphasizes the importance of obtaining adequate sleep during the week. Several mechanisms have been proposed to explain why reduced sleep results in greater body weight. These include alterations in the hormonal processes that regulate carbohydrate metabolism and increase the desire to consume caloric dense foods, and greater available time to eat (20). In a previous analysis of food intake in the TuCASA study, we did not find a relationship between dietary composition and body weight (17). Thus, it is unclear what underlying mechanism explains our finding.
Not surprisingly, age was the primary determinant of blood pressure in our analysis. This is consistent with the normal maturation in children’s blood pressure. However, there was a weak negative correlation between parent reported total and school night sleep durations and diastolic blood pressure. These findings are consistent with previous observations linking reduced sleep duration to higher blood pressure and hypertension in children (7-9). Proposed mechanisms for this relationship include heightened sympathetic nervous system activity and greater exposure to higher daytime blood pressures (6).
A weak association was also noted between diastolic blood pressure and caffeine consumption. In one study in adolescents, a dose response in diastolic but not systolic blood pressure was observed after acute administration of caffeine (21). However, this specificity has not always been found (22). Whether caffeine consumption is a significant risk factor in development of childhood hypertension is unclear. Although a recent large analysis of the NHANES cohort found that the prevalence of elevated blood pressure in children has declined in recent years, a corresponding reduction in caffeine consumption was not statistically significant (23).
In contrast to the inverse associations between parent reported sleep duration and BMI and blood pressure, no relationships were observed between these endpoints and oversleep. Thus, our findings differ from those of Kim et al who found that oversleep exerted a protective effect on weight in children (4). The explanation for this discordance is unclear, but racial and ethnic differences may have been a factor. Our cohort was comprised of Hispanic and Caucasian children and there were systematic differences in bedtime and sleep duration between Hispanics and Caucasian children. Specifically, parent-reported sleep duration during weekdays was shorter in Hispanic than in Caucasian children which appeared to be attributable to a later bedtime in the Hispanic children (24). The children in the afore-mentioned Kim et al study were Korean and the protective effect of oversleep on weight may be attributable to racial, socio-cultural, or dietary differences.
We found that sleep disordered breathing as represented by the RDI and snoring also impacted BMI and blood pressure. This is consistent with our previous findings (11), and others related to SDB and blood pressure in children (10, 12, 13).
In contrast to the associations between parent reported sleep duration and BMI and blood pressure, multivariate analyses failed to confirm any associations between child reported sleep duration and these outcomes. In addition, parent reported sleep times were greater than those reported by their children. Children as young as 8 years can provide meaningful health information when developmentally appropriate instruments are utilized (25). With respect to sleep, the report of the child may be quite different from a parent’s perception (26). Furthermore, both could differ from objective assessment. In the current study, univariate analyses indicated that both child and parent report of sleep duration were associated with BMI and blood pressure. However, only parent report was significant on multivariate analyses. It is possible that greater variability in the child reports was in part responsible for the failure to detect any significant associations. Regardless, it appears that parent reported sleep time represents a better signal than child report for any associations with body weight or blood pressure.
Major limitations to this analysis include a relatively small number of children in comparison to other cohorts and reliance on parent and children reporting of sleep durations. Although polysomnography was performed as part of TuCASA, there was no consistency as to whether they were performed on school or non-school nights. Furthermore, because only a single night of study was recorded, calculation of oversleep would not have been possible. Despite these limitations, TuCASA has several strengths including standardized data collection from a general population cohort and objective documentation of the presence of sleep disordered breathing.
In conclusion, reductions in sleep duration are associated with higher body weight and blood pressure. Reductions in school night sleep are particularly important. However, oversleep does not appear to have an impact on either body weight or blood pressure.
Acknowledgments
This work was supported by grant HL 62373 from the National Heart Lung and Blood Institute.
References
- Paruthi S, Brooks LJ, D'Ambrosio C, et al. Consensus Statement of the American Academy of Sleep Medicine on the Recommended Amount of Sleep for Healthy Children: Methodology and Discussion. J Clin Sleep Med. 2016;12(11):1549-61. [CrossRef] [PubMed]
- Li L, Zhang S, Huang Y, Chen K. Sleep duration and obesity in children: A systematic review and meta-analysis of prospective cohort studies. J Paediatr Child Health. 2017;53(4):378-85. [CrossRef] [PubMed]
- Ruan H, Xun P, Cai W, He K, Tang Q. Habitual Sleep Duration and Risk of Childhood Obesity: Systematic Review and Dose-response Meta-analysis of Prospective Cohort Studies. Sci Rep. 2015;516160. [CrossRef][PubMed]
- Kim CW, Choi MK, Im HJ, et al. Weekend catch-up sleep is associated with decreased risk of being overweight among fifth-grade students with short sleep duration. J Sleep Res. 2012;21(5):546-51. [CrossRef] [PubMed]
- Fatima Y, Doi SA, Mamun AA. Longitudinal impact of sleep on overweight and obesity in children and adolescents: a systematic review and bias-adjusted meta-analysis. Obes Rev. 2015;16(2):137-49. [CrossRef] [PubMed]
- Dean E, Bloom A, Cirillo M, et al. Association between habitual sleep duration and blood pressure and clinical implications: a systematic review. Blood Press. 2012;21(1):45-57. [CrossRef] [PubMed]
- Guo X, Zheng L, Li Y, et al. Association between sleep duration and hypertension among Chinese children and adolescents. Clin Cardiol. 2011;34(12):774-81. [CrossRef] [PubMed]
- Javaheri S, Storfer-Isser A, Rosen CL, Redline S. Sleep quality and elevated blood pressure in adolescents. Circulation. 2008;118(10):1034-40. [CrossRef] [PubMed]
- Kuciene R, Dulskiene V. Associations of short sleep duration with prehypertension and hypertension among Lithuanian children and adolescents: a cross-sectional study. BMC Public Health. 2014;14255-2458-14-255. [CrossRef] [PubMed]
- Bixler EO, Vgontzas AN, Lin HM, et al. Blood pressure associated with sleep-disordered breathing in a population sample of children. Hypertension. 2008;52(5):841-6. [CrossRef] [PubMed]
- Enright PL, Goodwin JL, Sherrill DL, Quan JR, Quan SF, Tucson Children's Assessment of Sleep Apnea study. Blood pressure elevation associated with sleep-related breathing disorder in a community sample of white and Hispanic children: the Tucson Children's Assessment of Sleep Apnea study. Arch Pediatr Adolesc Med. 2003;157(9):901-4. [CrossRef] [PubMed]
- Kwok KL, Ng DK, Chan CH. Cardiovascular changes in children with snoring and obstructive sleep apnoea. Ann Acad Med Singapore. 2008;37(8):715-21. [PubMed]
- Nisbet LC, Yiallourou SR, Walter LM, Horne RS. Blood pressure regulation, autonomic control and sleep disordered breathing in children. Sleep Med Rev. 2014;18(2):179-89. [CrossRef] [PubMed]
- Hwangbo Y, Kim WJ, Chu MK, Yun CH, Yang KI. Association between weekend catch-up sleep duration and hypertension in Korean adults. Sleep Med. 2013;14(6):549-54. [CrossRef] [PubMed]
- Goodwin JL, Enright PL, Kaemingk KL, et al. Feasibility of using unattended polysomnography in children for research--report of the Tucson Children's Assessment of Sleep Apnea study (TuCASA). Sleep. 2001;24(8):937-44. [PubMed]
- Goodwin JL, Kaemingk KL, Mulvaney SA, Morgan WJ, Quan SF. Clinical screening of school children for polysomnography to detect sleep-disordered breathing--the Tucson Children's Assessment of Sleep Apnea study (TuCASA). J Clin Sleep Med. 2005;1(3):247-54. [PubMed]
- Drescher AA, Goodwin JL, Silva GE, Quan SF. Caffeine and screen time in adolescence: associations with short sleep and obesity. J Clin Sleep Med. 2011;7(4):337-42. [CrossRef] [PubMed]
- National High Blood Pressure Education Program Working Group on High Blood Pressure in Children and Adolescents. The fourth report on the diagnosis, evaluation, and treatment of high blood pressure in children and adolescents. Pediatrics. 2004;114(2 Suppl 4th Report):555-76. [PubMed]
- Rechtschaffen A, Kales A. A Manual of Standardized Terminology,
Techniques and Scoring System for Sleep Stages of Human Subject. Washington, D.C.: US Government Printing Office, National Institute of Health Publication, 1968. - Ash T, Taveras EM. Associations of short sleep duration with childhood obesity and weight gain: summary of a presentation to the National Academy of Science's Roundtable on Obesity Solutions. Sleep Health. 2017;3(5):389-92. [CrossRef] [PubMed]
- Temple JL, Dewey AM, Briatico LN. Effects of acute caffeine administration on adolescents. Exp Clin Psychopharmacol. 2010;18(6):510-20. [CrossRef] [PubMed]
- Temple JL, Ziegler AM, Graczyk A, Bendlin A, Sion T, Vattana K. Cardiovascular responses to caffeine by gender and pubertal stage. Pediatrics. 2014;134(1):e112-9. [CrossRef] [PubMed]
- Xi B, Zhang T, Zhang M, et al. Trends in Elevated Blood Pressure Among US Children and Adolescents: 1999-2012. Am J Hypertens. 2016;29(2):217-25. [CrossRef] [PubMed]
- Combs D, Goodwin JL, Quan SF, Morgan WJ, Parthasarathy S. Longitudinal differences in sleep duration in Hispanic and Caucasian children. Sleep Med. 2016;1861-6. [CrossRef] [PubMed]
- Riley AW. Evidence that school-age children can self-report on their health. Ambul Pediatr. 2004;4(4 Suppl):371-376. [CrossRef] [PubMed]
- Owens JA, Spirito A, McGuinn M, Nobile C. Sleep habits and sleep disturbance in elementary school-aged children. J Dev Behav Pediatr. 2000;21(1):27-36. [PubMed]
Cite as: Quan SF, Combs D, Parthasarathy S. Impact of sleep duration and weekend oversleep on body weight and blood pressure in adolescents. Southwest J Pulm Crit Care. 2018;16(1):31-41. doi: https://doi.org/10.13175/swjpcc150-17 PDF
Role of Spousal Involvement in Continuous Positive Airway Pressure (CPAP) Adherence in Patients with Obstructive Sleep Apnea (OSA)
Salma Batool-Anwar, MD, MPH 2
Carol M. Baldwin, PhD, MSN 3
Shira Fass, PhD4
Stuart F. Quan, MD 1,2
1University of Arizona College of Medicine, Tucson, AZ USA
2Brigham and Women’s Hospital, Boston, MA USA
3Arizona State University College of Nursing and Health Innovation and College of Health Solutions, Phoenix, AZ USA
4Case Western Reserve University, Cleveland, Ohio USA
Abstract
Introduction: Little is known about the impact of spousal involvement on continuous positive airway pressure (CPAP) adherence. The aim of this study was to determine whether spouse involvement affects adherence with CPAP therapy, and how this association varies with gender.
Methods: 194 subjects recruited from Apnea Positive Pressure Long Term Efficacy Study (APPLES) completed the Dyadic Adjustment Scale (DAS). The majority of participants were Caucasian (83%), and males (73%), with mean age of 56 years, mean BMI of 31 kg/m2. & 62% had severe OSA. The DAS is a validated 32-item self-report instrument measuring dyadic consensus, satisfaction, cohesion, and affectional expression. A high score in the DAS is indicative of a person’s adjustment to the marriage. Additionally, questions related to spouse involvement with general health and CPAP use were asked. CPAP use was downloaded from the device and self-report, and compliance was defined as usage > 4 h per night.
Results: There were no significant differences in overall marital quality between the compliant and noncompliant subjects. However, level of spousal involvement was associated with increased CPAP adherence at 6 months (p=0.01). After stratifying for gender these results were significant only among males (p=0.03). Three years after completing APPLES, level of spousal involvement was not associated with CPAP compliance even after gender stratification.
Conclusion: Spousal involvement is important in determining CPAP compliance in males in the 1st 6 months after initiation of therapy but is not predictive of longer-term adherence. Involvement of the spouse should be considered an integral part of CPAP initiation procedures.
Abbreviations List
AASM: American Academy of Sleep Medicine
AHI: Apnena Hyponea Index
APPLES: Apnea Positive Pressure Long Term Efficacy Study
BMI: Body Mass Index
CPAP: Continuous positive airway pressure
DAS: Dyadic Adjustment Scale
EEG: Electroencephalogram
EMG: Electromyograms
EOG: Electroocculogram
OSA: Obstructive Sleep Apnea
PSG: polysomnography
Introduction
Obstructive Sleep apnea (OSA) is characterized by repetitive episodes of upper airway closure during sleep resulting in oxygen desaturation and frequent arousals. In addition to cardiovascular comorbidities, OSA has been linked to poor quality of life, depression and motor vehicle accidents. Recent data suggest an increase in the prevalence of OSA for both men and women (34% and 17.4% respectively) (1).
Continuous positive airway pressure (CPAP) is the treatment of choice for OSA. Poor adherence, however, remains a widely recognized problem limiting overall effectiveness of CPAP therapy. Prior studies have identified various factors and strategies to promote CPAP adherence (2). In addition to disease, educational, and technology-specific considerations that can affect CPAP adherence, social and psychological dynamics are important components of adherence as well.
Several studies have suggested that partner/spousal dyadic support can play a positive role in the patient’s overall health and health behaviors (3,4) . For example, higher CPAP adherence was reported among patients with bed partners (5), as well as persons who were married versus single (6). Little is known about the influence of spousal involvement on CPAP adherence. One study indicated that perceived spousal support predicted greater CPAP adherence among men with high disease severity; however, pressure to adhere to treatment by the wife was not of benefit and predicted poorer CPAP adherence (7). Another study indicated reduced marital conflict by OSA patients following 3 months of CPAP, suggesting that marital conflict resolution might serve as an intervention for CPAP adherence (8). Despite these hints that dyadic support may play a role in CPAP adherence, participants in both studies by Baron et al. (7.8) consisted primarily of men, and the studies focusing on CPAP adherence by Lewis et al. (5) and Gagnadoux et al. (6) included only men. Thus, the aim of the current study was to determine whether spouse involvement affects CPAP adherence and how this association differs by gender using data from a large randomized trial of CPAP versus sham CPAP to treat OSA.
Methods
Study Population and Protocol
The Apnea Positive Pressure Long-term Efficacy Study (APPLES) was a 6-month multicenter, randomized, double-blinded, 2-arm, sham-controlled, intention-to-treat study of CPAP efficacy on three domains of neurocognitive function in OSA. Three of the 5 APPLES Clinical Centers, the University of Arizona, Stanford University and St. Luke’s Hospital (Chesterfield, MO) participated in this ancillary study. A detailed description of the protocol has previously been published (9). Briefly, participants were either recruited through local advertisement, or from attending sleep clinics for evaluation of possible OSA. Symptoms indicative of OSA were used to prescreen potential participants. The initial clinical evaluation included administering informed consent, screening questionnaires, a history and physical examination, and a medical assessment by a study physician. Participants subsequently returned 2-4 weeks later for a 24-h sleep laboratory visit, during which polysomnography (PSG) was performed to confirm the diagnosis, followed by a day of neurocognitive, mood, sleepiness, and quality of life survey testing. Inclusion and exclusion criteria have been published previously and included age ≥ 18 years and a clinical diagnosis of OSA as defined by American Academy of Sleep Medicine (AASM) criteria. Only participants with an apnea hypopnea index (AHI) ≥ 10 by PSG were randomized to continue in the APPLES study. Exclusion criteria were previous treatment for OSA with CPAP or surgery, oxygen saturation on baseline PSG <75% for >10% of the recording time, history of motor vehicle accident-related to sleepiness within the past 12 months, presence of chronic medical conditions, use of various medications known to affect sleep or neurocognitive function, and various health and social factors that may impact standardized testing procedures (e.g., shift work).
Following the PSG, participants with an AHI ≥ 10 who met other enrollment criteria were randomized to CPAP or sham CPAP for continued participation in APPLES. After randomization, participants returned to the sleep laboratory for a CPAP or sham CPAP titration PSG. Subsequent assessments were made at 2, and 6 months post-randomization at which time a test battery was re-administered. At the conclusion of their 6-month post-randomization evaluations, each participant was informed of their treatment group assignment and offered CPAP treatment going forward. Approximately 36 months after the conclusion of APPLES, participants were sent the Dyadic Adjustment Scale (DAS) questionnaire with the addition of several additional questions related to health.
Assessment of Spouse involvement
Inclusion in the current analysis required that subjects were married during the APPLES study and remained married at the time of questionnaire administration. The DAS (10), a quality of marriage questionnaire, was utilized to assess marital relationship. It is a 32-item self-report instrument that incorporates four dimensions, including a 13 item dyadic consensus, 10 item dyadic satisfaction, 5 item dyadic cohesion, and 4 item affectional expression. A high DAS score is indicative of a person’s positive adjustment to the marriage. Additionally, questions related to spouse involvement with general health and CPAP use were asked (See Appendix for full questionnaire).
Polysomnography
The PSG montage included monitoring of the electroencephalogram (EEG, C3-A2 or C4-A1, O2-A1 or O1-A2), electro-oculogram (EOG, ROC-A1, LOC-A2), chin and anterior tibialis electromyograms (EMG), heart rate by 2-lead electrocardiogram, snoring intensity (anterior neck microphone), nasal pressure (nasal cannula), nasal/oral thermistor, thoracic and abdominal movement (inductance plethysmography bands), and oxygen saturation (pulse oximetry). All PSG records were electronically transmitted to a centralized data coordinating and PSG reading center. Sleep and wakefulness were scored using Rechtschaffen and Kales criteria (11). Apneas and hypopneas were scored using American Academy of Sleep Medicine Task Force (1999) diagnostic criteria (12, 13). Briefly, an apnea was defined by a clear decrease (> 90%) from baseline in the amplitude of the nasal pressure or thermistor signal lasting ≥ 10 sec. Hypopneas were identified if there was a clear decrease (> 50% but ≤ 90%) from baseline in the amplitude of the nasal pressure or thermistor signal, or if there was a clear amplitude reduction of the nasal pressure signal ≥ 10 sec that did not reach the above criterion, but was associated with either an oxygen desaturation > 3% or an arousal.
Obstructive events were scored if there was persistence of chest or abdominal respiratory effort. Central events were noted if no displacement occurred on either the chest or abdominal channels. Sleep apnea was classified as mild (AHI 10.0 to 15.0 events per hour), moderate (AHI 15.1 to 30.0 events per hour), and severe (AHI more than 30 events per hour) (12).
CPAP adherence
The primary dependent variable of interest was CPAP adherence and was assessed by nightly use of CPAP at the 6-months follow up visit. CPAP use was downloaded from the device and the participants were considered to be adherent if the mean CPAP use was > 4 hours per night at 6-months. Long-term CPAP adherence was measured as self-reported adherence (hours per night) at the time of the DAS administration.
Statistical Analysis
Statistical analyses were performed using STATA (Version 11, StataCorp TX USA). Univariate and multivariate logistic regression models were used to estimate the degree to which variables correlated with CPAP adherence. We examined the association between CPAP adherence and following variables: OSA severity as measured by the AHI, age, baseline body mass index (BMI, kg/m2), spousal involvement and the DAS. For these models, dichotomous variables were created for OSA severity (AHI < 15 vs. ≥ 15), obesity (BMI <30 kg/m2 vs. ≥30 kg/m2) and CPAP adherence (< 4 hours/night vs. ≥4 hours/night). Spousal involvement was ascertained using a 5 point Lickert scale and analyzed as a continuous variable.
To assess predictors of CPAP adherence we used multiple regression models. Unpaired t-tests were used to assess the effect of gender, age, OSA severity, BMI, and CPAP adherence in both the CPAP and Sham CPAP groups. Data for continuous and interval variables were expressed as mean ± SD, and as a percentage for categorical variables. Statistical significance was set at a P value <0.05, two-tailed. The variables that produced P value of < 0.05 were included in the final model.
Results
Baseline demographic data on participants (N=194) who completed the DAS are outlined in Table 1.
Table1. Baseline Characteristics of APPLES Participants Who Completed Dyadic Data.

The majority of the participants were Caucasian (83%) and males (73%), with mean age of 56 years and a mean BMI of 31 kg/m2. Over half of the participants had severe OSA (62%). Table 2a demonstrates CPAP adherence at 6 months using multivariate analysis.
Table 2A. Multivariate Analysis of Adherence to CPAP or Sham CPAP at 6 Months.

The CPAP adherence was independently associated with advanced age (p < 0.01) and increasing spousal involvement (p < 0.01). After stratifying by treatment group, the association between CPAP adherence and spousal involvement was seen only amongst the CPAP group (Table 2b).
Table 2B. Multivariate Analysis of Adherence to CPAP at 6 Months.

Adjustment to marriage as reflected by items on the DAS questionnaire, however, was not associated with CPAP adherence.
Notably, after gender stratification, significant association between spousal involvement and CPAP adherence was limited to men alone (p=0.03). Three years after completing APPLES, 82 participants were still adherent by self-report (Table 3).
Table 3. Multivariate Analysis CPAP Adherence 3 years After Completing APPLES Study (based on subjective adherence).

At this time point, spousal involvement was not associated with CPAP adherence even after gender stratification.
Discussion
This multicenter double blind study demonstrates that spousal involvement is important in determining CPAP adherence during the initial treatment period, but has no effect on long-term adherence. Notably, the positive results for adherence were seen only among husbands using CPAP, but there was no effect on wives using CPAP. In line with previous research, we also found that increase in age was associated with greater CPAP adherence among both men and women.
Prior studies have indicated that married versus single, CPAP patients with bed partners, perceived spousal support, and quality of marital relationship all play a role in promoting CPAP adherence (5-8). Although these studies support the idea of social support as a conduit to CPAP adherence, the role of spousal involvement was not clear, sample sizes in the spousal role studies were small, and CPAP users were men, which reduces generalizability.
Baron et al. (3) used a spousal involvement measure, including positive and negative collaboration and one-sided items one week after beginning CPAP treatment (N=23 married men on CPAP), in addition to an interpersonal measure of supportive behaviors at 3 months to evaluate interpersonal qualities (n=16/23 responded). These investigators found that perceived collaborative involvement was related to greater CPAP adherence at 3 months (p=0.002). These findings are similar to our study in that spousal support, at least for husbands on CPAP, fostered greater adherence during the initial period of treatment.
Our observations and those of Baron et al. (14) fit well with the theories of motivation. The fundamental fact of motivation and adherence in healthcare is that individuals cannot be forced to change their behaviors. The behavior change, in this case the CPAP adherence, may be initiated by extrinsic motivation. External motivation may be rewards, punishments, or pressure from other people, such as family members or healthcare providers. However, extrinsic motivation, such as spousal pressure, is less effective in the long-term. In order to sustain long term behavioral change for CPAP adherence one needs to rely on intrinsic motivation which can be strengthened by examining the decisional balance of the ratio between a patient’s perceived pros and cons for engaging in a health behavior. The decisional balance has been found to be predictive of adherence to treatment in a variety of healthcare settings.
Our study also found increased age as an independent predictor of CPAP adherence at 6-months, yet the results were not significant for long-term adherence. Previous studies have also demonstrated conflicting results on the association between age and CPAP adherence. Sin et al. (15) found that a 10 year increment in age resulted in 0.24 ± 0.11-h increase in CPAP use. Alternatively, McArdle and colleagues (16) found that older patients were less likely to use their CPAP machines. Similarly, Janson et al. (17) found older age to be an independent risk factor for discontinuing CPAP treatment, and this finding was thought to be secondary to nasal, or pharyngeal problems. In another study, Russo-Magno et al. (18) found that adherent patients were younger in age compared to non-adherents, and increasing age made CPAP adherence difficult. Cognitive and physical impairments were thought to be contributing to difficulty with CPAP adherence. Mean age in this cohort was 73 years, which was higher than the mean age in our study. It is possible that these inconsistent associations of age on CPAP adherence may be related to the length of follow-up as well. With longer durations, the effect of time on comorbidities in the elderly may make adherence more difficult.
To our knowledge, this is the first study to demonstrate a gender bias in support for CPAP adherence. While men on CPAP were significantly more likely to adhere with support from their wives, there was no such effect for married women on CPAP, suggesting little to no support from their husbands. Although the effect of gender on CPAP adherence and spousal involvement has not been studied, previous research suggests that women are more likely to be the health caregivers in families, and thus exercise more social control (19). It is the social norm and expectation that women are often involved in their husbands’ health. As indicated in the literature regarding type 2 diabetes (20), male patients and their wives shared an expectation that the wives will be involved in their care while female patients and their husbands did not have similar expectations. We can support this finding in relationship to CPAP adherence.
Not surprisingly, spousal support for adherence did not apply to sham CPAP. This suggests that if an intervention is not having any perceived benefit, spousal involvement will have little impact on adherence.
There are several limitations to this study. A major limitation is self-reported long term CPAP adherence. Additionally, our study was limited to husbands and wives on CPAP completing the DAS; their respective spouses were not asked about their degree of involvement. Moreover, it is unclear which components of spouse involvement played a role in CPAP adherence. We cannot assume that patients welcome all types of spouse involvement. Spouse involvement may be perceived by patients as control and nagging and may not be advantageous for all patients (21). In the context of chronic illness significant differences are demonstrated across couples in expectations for spouse involvement (20).
Despite these limitations, to our knowledge this is the first study of its type that examined spousal support for both men and women on CPAP supporting generalizability of our findings. Other strengths of this study include a large number of participants across multiple sites, randomized CPAP and Sham CPAP control groups, and objective documentation of CPAP adherence at 6 months.
Dyadic coping has been utilized in other health related interventions and can also be used to improve CPAP adherence. Ye et al. (4) has provided a comprehensive review of dyadic support in CPAP adherence, including methodological considerations, recommendations for future research, and implications for interventions. In tandem with the Ye et al. (4) review, our findings, particularly with respect to the need for spousal support of wives on CPAP, can provide a springboard for future clinical/intervention studies to promote CPAP adherence for men and women, to develop gender-relevant training needs to support their spouse on CPAP, and to determine spousal support activities that are the most efficient at promoting CPAP adherence.
Acknowledgments
APPLES was funded by contract 5UO1-HL-068060 from the National Heart, Lung and Blood Institute. The APPLES pilot studies were supported by grants from the American Academy of Sleep Medicine and the Sleep Medicine Education and Research Foundation to Stanford University and by the National Institute of Neurological Disorders and Stroke (N44-NS-002394) to SAM Technology. In addition, APPLES investigators gratefully recognize the vital input and support of Dr. Sylvan Green who died before the results of this trial were analyzed, but was instrumental in its design and conduct.
Administrative Core
Clete A. Kushida, MD, PhD; Deborah A. Nichols, MS; Eileen B. Leary, BA, RPSGT; Pamela R. Hyde, MA; Tyson H. Holmes, PhD; Daniel A. Bloch, PhD; William C. Dement, MD, PhD
Data Coordinating Center
Daniel A. Bloch, PhD; Tyson H. Holmes, PhD; Deborah A. Nichols, MS; Rik Jadrnicek, Microflow, Ric Miller, Microflow Usman Aijaz, MS; Aamir Farooq, PhD; Darryl Thomander, PhD; Chia-Yu Cardell, RPSGT; Emily Kees, Michael E. Sorel, MPH; Oscar Carrillo, RPSGT; Tami Crabtree, MS; Booil Jo, PhD; Ray Balise, PhD; Tracy Kuo, PhD
Clinical Coordinating Center
Clete A. Kushida, MD, PhD, William C. Dement, MD, PhD, Pamela R. Hyde, MA, Rhonda M. Wong, BA, Pete Silva, Max Hirshkowitz, PhD, Alan Gevins, DSc, Gary Kay, PhD, Linda K. McEvoy, PhD, Cynthia S. Chan, BS, Sylvan Green, MD
Clinical Centers
Stanford University
Christian Guilleminault, MD; Eileen B. Leary, BA, RPSGT; David Claman, MD; Stephen Brooks, MD; Julianne Blythe, PA-C, RPSGT; Jennifer Blair, BA; Pam Simi, Ronelle Broussard, BA; Emily Greenberg, MPH; Bethany Franklin, MS; Amirah Khouzam, MA; Sanjana Behari Black, BS, RPSGT; Viola Arias, RPSGT; Romelyn Delos Santos, BS; Tara Tanaka, PhD
University of Arizona
Stuart F. Quan, MD; James L. Goodwin, PhD; Wei Shen, MD; Phillip Eichling, MD; Rohit Budhiraja, MD; Charles Wynstra, MBA; Cathy Ward, Colleen Dunn, BS; Terry Smith, BS; Dane Holderman, Michael Robinson, BS; Osmara Molina, BS; Aaron Ostrovsky, Jesus Wences, Sean Priefert, Julia Rogers, BS; Megan Ruiter, BS; Leslie Crosby, BS, RN
St. Mary Medical Center
Richard D. Simon Jr., MD; Kevin Hurlburt, RPSGT; Michael Bernstein, MD; Timothy Davidson, MD; Jeannine Orock-Takele, RPSGT; Shelly Rubin, MA; Phillip Smith, RPSGT; Erica Roth, RPSGT; Julie Flaa, RPSGT; Jennifer Blair, BA; Jennifer Schwartz, BA; Anna Simon, BA; Amber Randall, BA
St. Luke’s Hospital
James K. Walsh, PhD, Paula K. Schweitzer, PhD, Anup Katyal, MD, Rhody Eisenstein, MD, Stephen Feren, MD, Nancy Cline, Dena Robertson, RN, Sheri Compton, RN, Susan Greene, Kara Griffin, MS, Janine Hall, PhD
Brigham and Women’s Hospital
Daniel J. Gottlieb, MD, MPH, David P. White, MD, Denise Clarke, BSc, RPSGT, Kevin Moore, BA, Grace Brown, BA, Paige Hardy, MS, Kerry Eudy, PhD, Lawrence Epstein, MD, Sanjay Patel, MD
*Sleep HealthCenters for the use of their clinical facilities to conduct this research
Consultant Teams
Methodology Team: Daniel A. Bloch, PhD, Sylvan Green, MD, Tyson H. Holmes, PhD, Maurice M. Ohayon, MD, DSc, David White, MD, Terry Young, PhD
Sleep-Disordered Breathing Protocol Team: Christian Guilleminault, MD, Stuart Quan, MD, David White, MD
EEG/Neurocognitive Function Team: Jed Black, MD, Alan Gevins, DSc, Max Hirshkowitz, PhD, Gary Kay, PhD, Tracy Kuo, PhD
Mood and Sleepiness Assessment Team: Ruth Benca, MD, PhD, William C. Dement, MD, PhD, Karl Doghramji, MD, Tracy Kuo, PhD, James K. Walsh, PhD
Quality of Life Assessment Team: W. Ward Flemons, MD, Robert M. Kaplan, PhD
APPLES Secondary Analysis-Neurocognitive (ASA-NC) Team: Dean Beebe, PhD, Robert Heaton, PhD, Joel Kramer, PsyD, Ronald Lazar, PhD, David Loewenstein, PhD, Frederick Schmitt, PhD
National Heart, Lung, and Blood Institute (NHLBI)
Michael J. Twery, PhD, Gail G. Weinmann, MD, Colin O. Wu, PhD
Data and Safety Monitoring Board (DSMB)
Seven year term: Richard J. Martin, MD (Chair), David F. Dinges, PhD, Charles F. Emery, PhD, Susan M. Harding MD, John M. Lachin, ScD, Phyllis C. Zee, MD, PhD
Other term: Xihong Lin, PhD (2 yrs), Thomas H. Murray, PhD (1 yr)
References
- Peppard PE, Young T, Barnet JH, Palta M, Hagen EW, Hla KM. Increased prevalence of sleep-disordered breathing in adults. Am J Epidemiol. 2013;177(9):1006-14. [CrossRef] [PubMed]
- Sawyer AM, Gooneratne NS, Marcus CL, Ofer D, Richards KC, Weaver TE. A systematic review of CPAP adherence across age groups: clinical and empiric insights for developing CPAP adherence interventions. Sleep Med Rev. 2011;15(6):343-56. [CrossRef] [PubMed]
- Baron KG, Gunn HE, Czajkowski LA, Smith TW, Jones CR. Spousal involvement in CPAP: does pressure help? J Clin Sleep Med. 2012;8(2):147-53. [CrossRef] [PubMed]
- Ye L, Malhotra A, Kayser K, et al. Spousal involvement and CPAP adherence: A dyadic perspective. Sleep Med Rev. 2015;19:67-74. [CrossRef] [PubMed]
- Lewis KE, Seale L, Bartle IE, Watkins AJ, Ebden P. Early predictors of CPAP use for the treatment of obstructive sleep apnea. Sleep. 2004; 27(1):134-8. [CrossRef] [PubMed]
- Gagnadoux F, Le Vaillant M, Goupil F, et al. Influence of marital status and employment status on long-term adherence with continuous positive airway pressure in sleep apnea patients. PLoS One.6(8):e22503. [CrossRef] [PubMed]
- Baron KG, Smith TW, Berg CA, Czajkowski LA, Gunn H, Jones CR. Spousal involvement in CPAP adherence among patients with obstructive sleep apnea. Sleep Breath. 2011;15(3):525-34. [CrossRef] [PubMed]
- Baron KG, Smith TW, Czajkowski LA, Gunn HE, Jones CR. Relationship quality and CPAP adherence in patients with obstructive sleep apnea. Behav Sleep Med. 2009;7(1):22-36. [CrossRef] [PubMed]
- Kushida CA, Nichols DA, Quan SF, et al. The apnea positive pressure long-term efficacy study (APPLES): rationale, design, methods, and procedures. J Clin Sleep Med. 2006; 2(3):288-300. [PubMed]
- Carey MP, Spector IP, Lantinga LJ, Krauss DJ. Reliability of the dyadic adjustment scale. Psychol Assessment. 1993;5(2):238. [CrossRef] [PubMed]
- Rechtschaffen A, Kales A. A manual of standardized terminology, techniques and scoring system for sleep stages of human subjects. Bethesda, Md., U. S. National Institute of Neurological Diseases and Blindness, Neurological Information Network, 1968.
- Flemons WW, Buysse D, Redline S, Pack A. The report of American academy of sleep medicine task force. Sleep related breathing disorders in adults: recommendations for syndrome definition and measurement techniques in clinical research. Sleep. 1999;22(5):667-89. [CrossRef] [PubMed]
- Quan SF, Gillin JC, Littner MR, Shepard JW. Sleep-related breathing disorders in adults: Recommendations for syndrome definition and measurement techniques in clinical research. editorials. Sleep. 1999;22(5):662-89. [CrossRef] [PubMed]
- Prochaska JO, DiClemente CC. Transtheoretical therapy: Toward a more integrative model of change. Psychother-Theor Res. 1982;19(3):276. [CrossRef]
- Sin DD, Mayers I, Man GCW, Pawluk L. Long-term compliance rates to continuous positive airway pressure in obstructive sleep apnea: a population-based study. CHEST. 2002;121(2):430-5. [PubMed]
- McArdle N, Kingshott R, Engleman HM, Mackay TW, Douglas NJ. Partners of patients with sleep apnoea/hypopnoea syndrome: effect of CPAP treatment on sleep quality and quality of life. Thorax. 2001;56(7):513-8. [CrossRef] [PubMed]
- Janson C, Nöges E, Svedberg-Brandt S, Lindberg E. What characterizes patients who are unable to tolerate continuous positive airway pressure (CPAP) treatment? Respir Med. 2000; 94(2): 145-9. [CrossRef] [PubMed]
- Russo‐Magno P, O'Brien A, Panciera T, Rounds S. Compliance with CPAP therapy in older men with obstructive sleep apnea. J Am Geriatr Soc. 2001;49(9):1205-11. [CrossRef] [PubMed]
- Umberson D. Gender, marital status and the social control of health behavior. Soc Sci Med. 1992;34(8):907-17. [CrossRef] [PubMed]
- Seidel AJ, Franks MM, Stephens MAP, Rook KS. Spouse control and type 2 diabetes management: moderating effects of dyadic expectations for spouse involvement. Fam Relat. 2012; 61(4):698-709. [CrossRef] [PubMed]
- Tucker JS. Health-related social control within older adults' relationships. J of Gerontol B: Psychol Sci Soc Sci. 2002;57(5):P387-P395. [PubMed]
Cite as: Batool-Anwar S, Baldwin CM, Fass S, Quan SP. Role of spousal involvement in continuous positive airway pressure (CPAP) adherence in patients with obstructive sleep apnea (OSA). Southwest J Pulm Crit Care. 2017;14(5):213-27. doi: https://doi.org/10.13175/swjpcc034-17 PDF